Good morning, Traders!
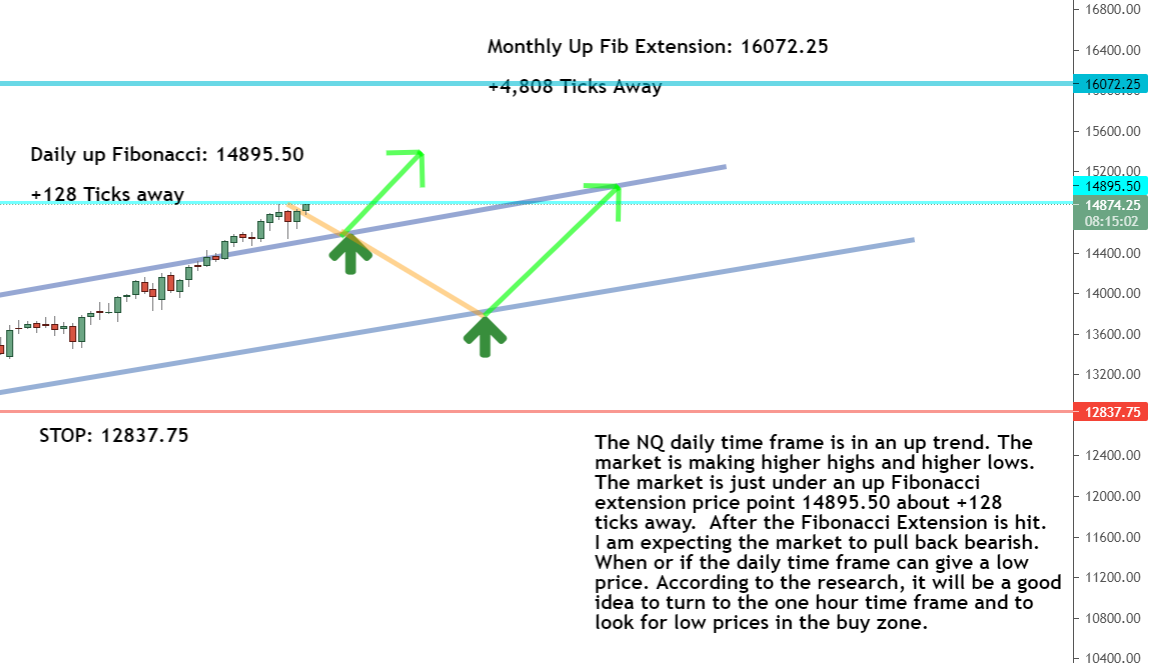
The Nasdaq 100 (NQ) has fulfilled our up Fibonacci extension just as we predicted. The anticipated retracement (temporary price drop) hit and support has held. Now we can prepare for the next up Fibonacci that will put us on track to hit 16072.25 with a +4000 tick movement.
Future price prediction in situations like this one can be tricky, but I’ve taken all of the guesswork out of the process! Read my article on how we anticipate future price direction to see how it all works.
This setup is a great opportunity to learn how to enter a futures market at just the right time. You can learn about Fibonacci extensions and how to buy the market after a counter trendline break.
But without the right strategy, it’s challenging to pull off those winning trades. Well, I’m here to help!See how I can help you become a money-making futures trader in no time.
Now let’s take a look at the timeframe analysis for the NQ setup today as we prepare to get this new week of trading started on the right foot:Daily Timeframe Analysis
The daily NQ timeframe shows us that the market has fulfilled the recent up Fibonacci extension. We needed the market to close below the previous high and that’s exactly what happened.
Now, we prepare for the market to work toward the next up Fibonacci extension, giving us an overall price movement of over +4000 ticks!DAILY TIMEFRAME

The direction within the daily timeframe is up

The current direction for the one-hour timeframe is up

The market U-turned off support and is moving up
Learn more about the Daily Direction Indicators here…

The NQ has fulfilled the up Fibonacci extension in the daily timeframe. Now we prepare for the next extension toward 16072.25
This is a good opportunity to see how these tick movements work on a candlestick chart. Read my informative article on how to read a candlestick chart before going any further.
One-Hour Timeframe Analysis
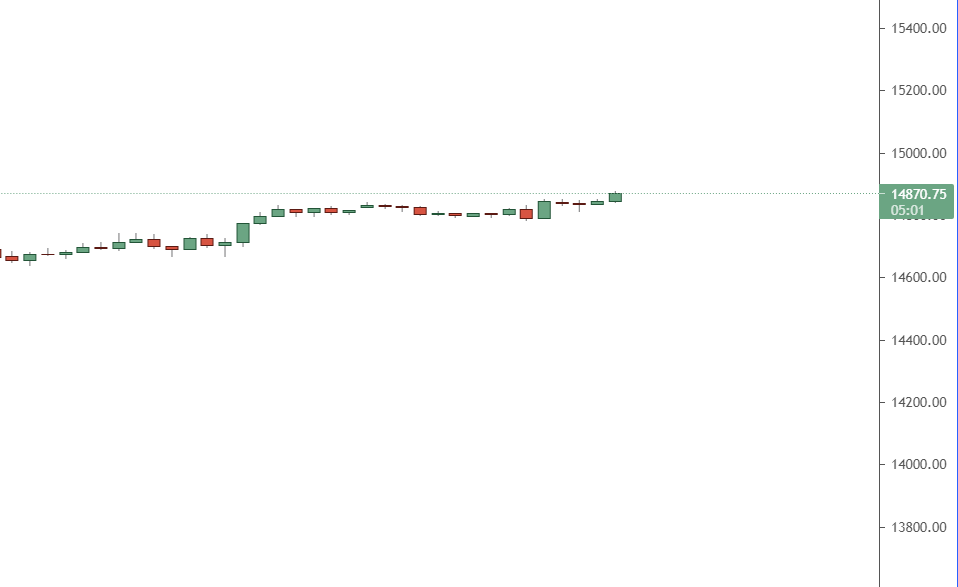
When we turn toward the one-hour timeframe, we can see that the direction of the NQ is still up.
The market is making higher highs and higher lows. We can expect the market to continue this trend as it heads toward our next high price.

The NQ one-hour timeframe is positive as it makes higher highs and higher lows. Now is the time to watch for low prices in the buy zone so we can enter the NQ and make money!
As the market moves, we can expect up and down shifts within the market. That’s because the market trades in waves. You can look at today’s charts and see the wave movement for yourself.
You can get even more information about these market trading patterns in my free article here.The Bottom Line
The long-term and short-term directions for the Nasdaq 100 (NQ) are up, with the market ready to hit a new high price.
As the price works its way to the top, we’ll look for a low price to buy when the market is in the buy zone.
Don’t forget that the market trades in waves, so the occasional dip shouldn’t scare us out of the NQ as it heads back up!

We’re preparing for the NQ to work toward a new high price
While all of this info on the NQ is great, you can’t really do anything with it unless you know how to get in the market. Are you still trying to figure out how to master futures markets? I’m here to help! Don’t get frustrated trying to do this all alone. Let me show you how to build success as a futures trader today. You’ll be ready to make money with the next big trading opportunity!
Keep On Trading,

Mindset Advantage: Embrace Pressure
Most professional athletes will tell you there’s good pressure and bad pressure.
It brings clarity and focus when used properly.
Bad pressure causes you to freeze. To panic. Everything speeds up or slows down. Bad decisions get made.
Good pressure? It brings focus, clarity and a keen awareness of the opportunity and hazards that surround you. If you love what you do, trade because it brings you freedom, and see the opportunity it can bring to your life.
Embrace pressure… the good pressure.Traders Training Session

Understanding Futures Contract Sizes and Tick Values


