
Market bulls continued to stampede the bearish camp this week as the S&P 500 index notched a huge gain of 2.2% — its largest weekly run since June.
The buying has been relentless for the general stock market over the last five weeks, with the gains only accelerating to the upside.
This week’s action brings the total gain for the past five weeks to 8.2% for the S&P and 11.6% for the Nasdaq.
And for the smaller-cap stocks that we like to trade, the five-week gain for the Russell 2000 small-cap index is 8.8%, with a big breakout this week.
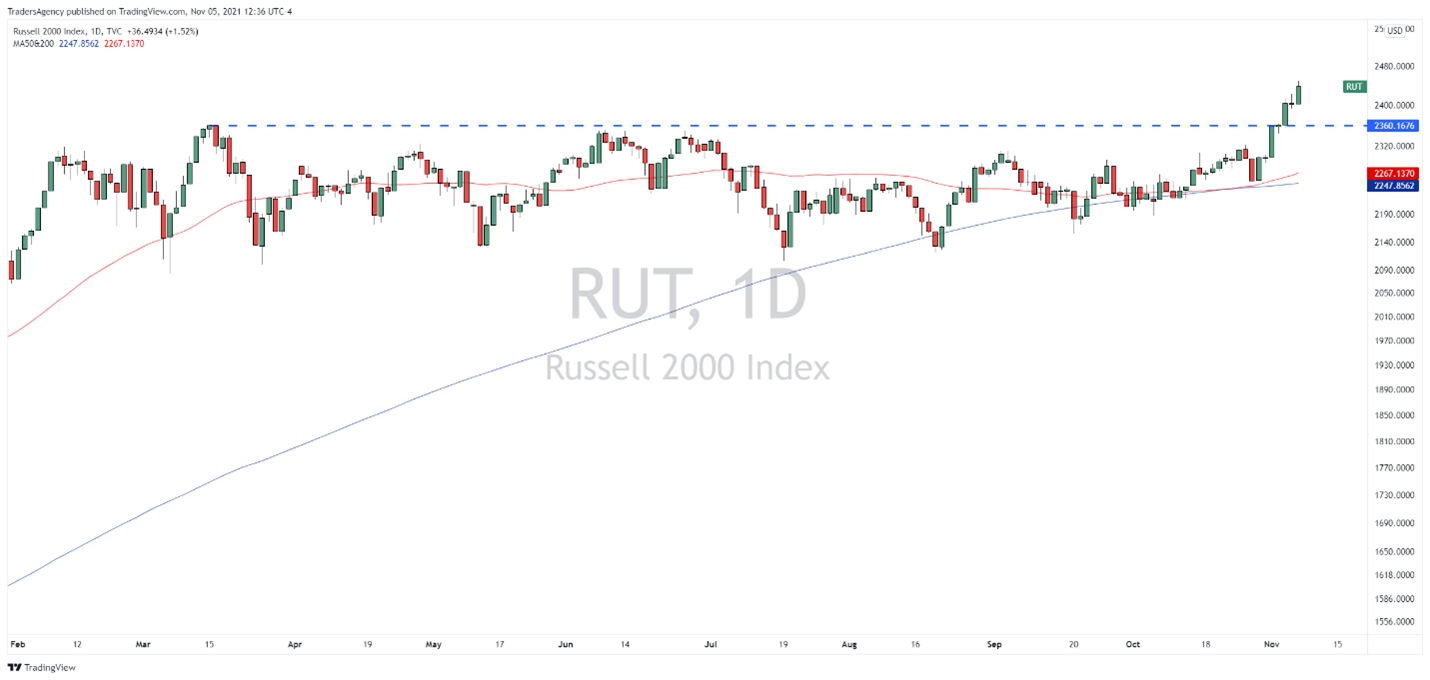
As you can see in the chart above, the index rallied above the previous all-time highs set back in March thanks to the ongoing bullish push.
Notice how the index contended with and held both its 50- and 200-day moving averages (blue and red lines on the chart) before breaking higher.
It’s also a good sign that the 50-day average is beginning to turn higher again after flattening out for several weeks.
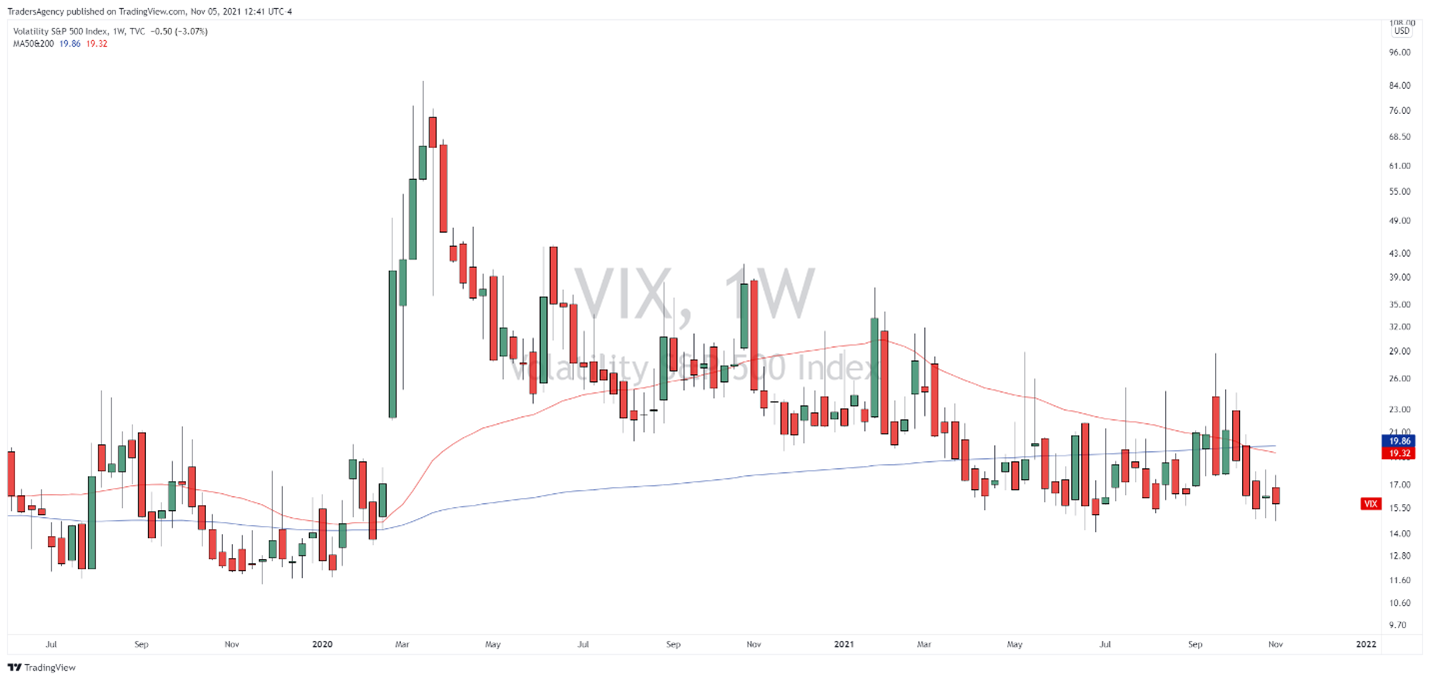
Furthermore, if we look at a weekly chart of the S&P 500 Volatility Index (VIX), you can also see the bullish action.
On a weekly timeframe, the VIX has settled into the bottom of its range at the 15-16 area.
And while the VIX did tick up slightly during Friday’s session, the overall picture doesn’t indicate that traders are worried about any sharp declines in the market right now.
With that in mind, I have three new picks for the Watchlist below that have not yet followed the market to new highs.
However, each of them look primed from a technical standpoint to break out of key consolidation patterns and ride the market to the upside.
TechTarget, Inc.
TechTarget, Inc. (TTGT) is an enterprise software company focused on providing intent-driven market and sales data for business-to-business (B2B) companies.
Here’s how the chart is setting up:
And here’s how the stock is setting up with my Stock Surge Indicator (SSI):
- Surge score: 88/100
- % Above 52-wk low: 103%
- MFI reading: 72
- Sales growth: +92%
- Triple momentum: yes
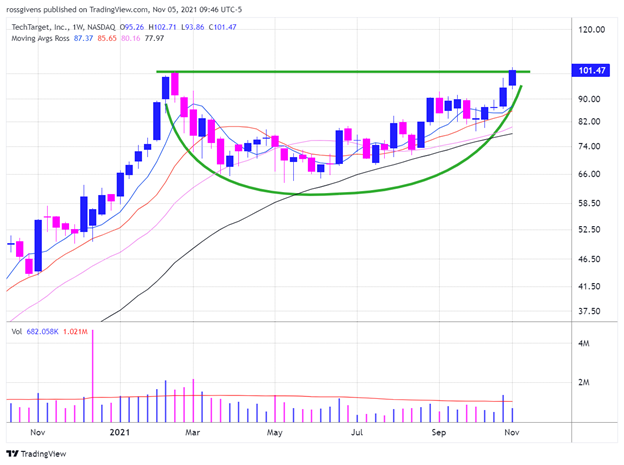
As you see in the weekly chart above, the stock is completing a large cup-and-handle pattern that started back in February.
This is one of the top-performing stocks in one of the strongest market sectors right now. TTGT also reported earnings last week and is now making new highs.
As of Friday morning, shares were trading in the $101 area. I would consider buying TTGT up to $103.00 and work a stop at $93.50.
Avid Technology, Inc.
Avid Technology, Inc. (AVID) is the $1.4 billion communication services company focused on developing software and solutions for audio and video content creation, management and distribution, including cloud products and shared storage systems.
Here’s how the chart is setting up:
And here’s how the stock is setting up with my SSI:
- Surge score: 93/100
- % Above 52-wk low: 201%
- MFI reading: 60
- Sales growth: +20%
- Triple momentum: no
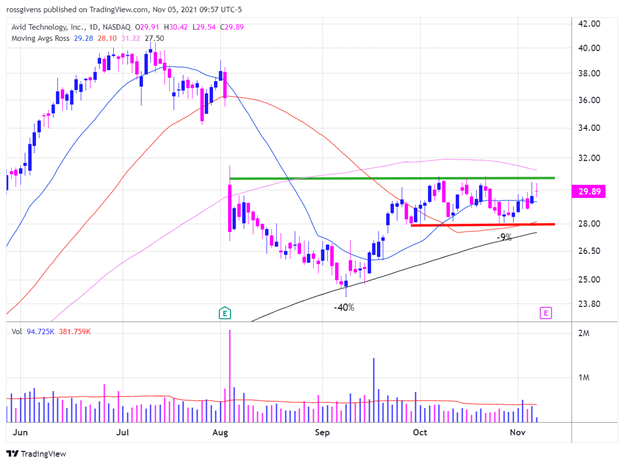
After soaring over 800% in just 16 months, AVID stock took a much-needed breath.
The 40% retracement caused the short-term trend to turn down. But after finding support at the 200-day moving average, things appear to be trending higher once again.
Price action has tightened, and traders can now buy the breakout while risking just 9%.
I will be looking to buy AVID at $30.85 and targeting a gap fill up to the $36 area. You can use $27.80 for a stop.
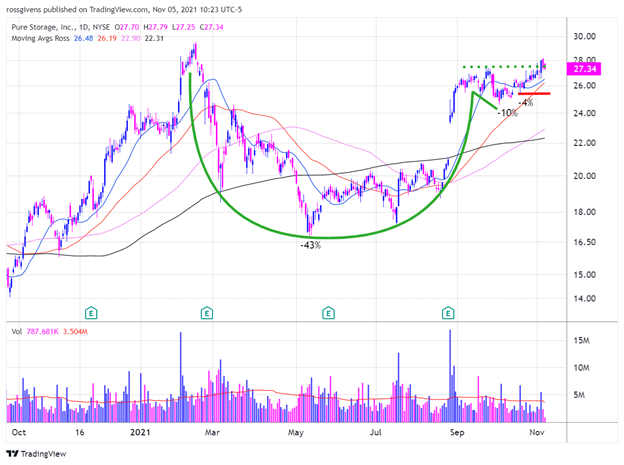
Pure Storage, Inc.
Pure Storage, Inc. (PSTG) is another $8 billion technology and data storage solutions provider. It also operates cloud-based data and artificial intelligence-ready infrastructure products and subscription-based services.
Here’s how the chart is setting up:
And here’s how the stock is setting up with my SSI:
- Surge score: 88/100
- % Above 52-wk low: 62.9%
- MFI reading: 67
- Sales growth: +23%
- Triple momentum: yes
PSTG is giving us a pattern inside a pattern.
From a longer-term perspective, you can see the large cup-and-handle formation that is just beginning to break out.
At the same time, a zoomed in view of the last two months shows our traditional consolidation pattern with price tightening from left to right.
The flash-based storage systems provider is two weeks out from earnings, so we have some time on this one.
If I can get a nice profit cushion before the Nov. 24 announcement, I would be comfortable holding through earnings.
The $27.50 pivot price was hit last week, so PSTG is an active buy below $28.00. Work a stop loss at $25.35.
Embrace the Surge,

Ross Givens
Editor, Stock Surge Daily


