Big tech stocks, as tracked by the Nasdaq 100 Index futures contract (NQ), were in the driver’s seat for the US stock market for last year’s rally.
But this year, the big tech index has been a big leader to the downside.
So, let’s dive in and take a further look at the market for the NQ to see if it is set for a further downside move in the sell zone.
We want to see what this market may be holding right now and whether there is some further downside or if there is a potential bounce in the making…
The Nasdaq Futures (NQ) Market Review
Here’s how the chart is setting up for the Nasdaq 100 futures contract (NQ)…

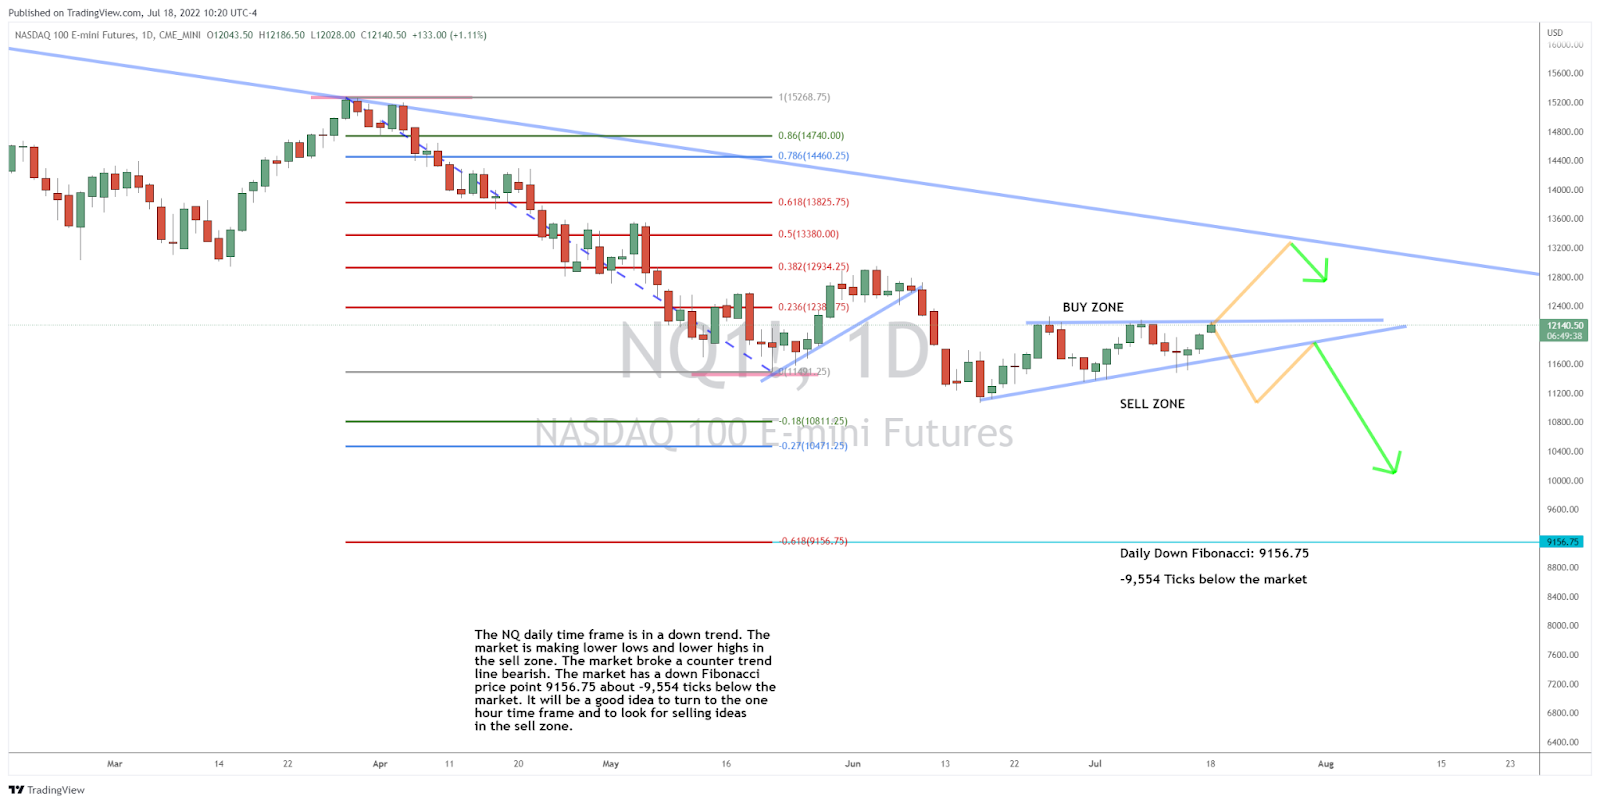
The NQ daily time frame is in a down trend, with the market making lower lows and lower highs in the sell zone.
The market broke a counter trend line bearish, and it has a down Fibonacci price point at 9,156.75, about -9,554 ticks below the market.
It will be a good idea to turn to the one hour time frame and to look for selling ideas
in the sell zone.
The Bottom Line
For more on the markets as well as trading education and trading ideas like this one, look for the next edition of Josh’s Daily Direction in your email inbox each and every trading day.
I’ll be bringing you more of my stock and futures contract trading tutorials as well as some additional trading ideas.
And if you know someone who’d love to make this a part of their daily trading routine, send them over to joshsdailydirection.com to get signed up!
Keep on trading,

P.S. In addition to my trades in the futures contract markets, my pal Ross Givens here at Traders Agency continues to come up with some great under-the-radar stocks for stealth profit opportunities.
And he showcases these opportunities in his premium Stealth Trades service…
To learn more about how to become a stealth stock trader following Ross’s lead, click here now.
The post Trading Tech in a Down Trend appeared first on Josh Daily Direction.


