
The S&P 500 (SPX) index has closed lower in each of the last five weeks.
That figure is set to increase to six down weeks in a row if we don’t see a turnaround by Friday’s close.
And it would have to be some turnaround…
The index is down another 3.2% this week and breaking below the key 4,000 level.
Before this week, the last time the S&P was below 4,000 was on April 1, 2021 — more than a year ago.
Unfortunately for the bulls, there could be more selling in store.
Today, I’m going to give you three big reasons why I say that…
The Technical Picture
Before we get into some of the wonkier stuff, let’s take a look at a simple weekly chart of the S&P 500.
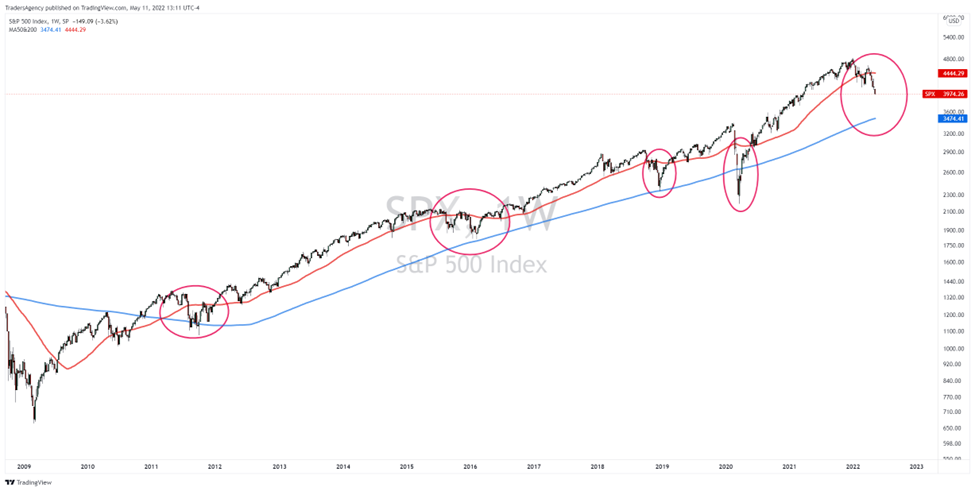
In the chart above, I’ve zoomed out so that we can see the entire bull market advance since the Great Financial Crisis.
I’ve also included the 50-week moving average (red line) and 200-week moving average (blue line).
After falling below it during the 2008 crash, the 50-week finally moved back above the 200-week in early 2011. And it has stayed there since then.
Now, when I was looking at this chart, something interesting caught my eye…
Every time the S&P closes below its 50-week line for at least two weeks in a row, the index falls to, near or below its 200-week line.
Yes, there are several instances where the index closed below its 50-week line and then immediately rallied back above it the next week.
But when there are two consecutive weekly closes below that red line, the index has made its way towards the lower blue line each time.
Sometimes it happens quickly, and other times — like in the 2015-2016 consolidation period — it can take months.
This track record is pretty solid, and if it holds true, the S&P could make a move towards its current 200-week line around 3,475.
After all, we’ve seen the S&P close below the 50-week line for four weeks in a row back in February-March and again for four weeks in a row from April-May.
Of course, this is no guarantee that the index will keep falling, but it’s an observation I wanted to point out to everyone.
Watching for a Base in the VIX
Now, going a bit deeper, I want to talk about the S&P 500 in relation to the S&P 500 Volatility Index (VIX), which is also sometimes called the market’s “fear gauge.”
As regular readers know, the S&P and the VIX are typically inversely correlated. In other words, when the S&P moves down, the VIX tends to move up.
And you can see that relationship in the daily chart below.
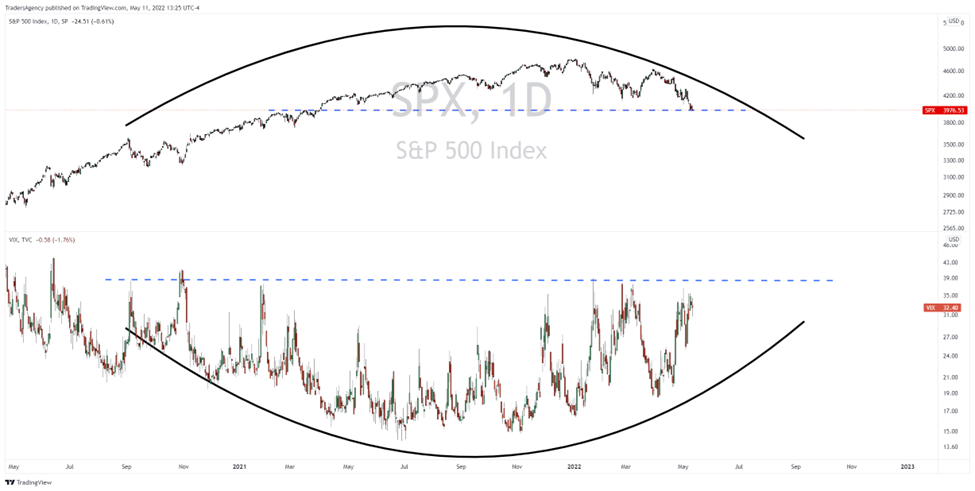
You’ve heard me talk about bases before and how they can lead to big breakouts.
Well, it looks like a big base has been forming on the VIX for a while that is coinciding with a potential “rounding top” pattern in the S&P 500.
You’ll also notice that I’ve drawn a horizontal boundary on each chart. The level to watch on the VIX is somewhere between 35 and 40, which has acted as resistance over the last year or so.
And the level to watch on the S&P, which I mentioned above, is the key 4,000 level.
If the VIX pushes through the 40 level, I wouldn’t be at all surprised to see the S&P 500 trading further below the 4,000 level.
The Bearish Cherry on Top
Now, I’m not telling you all of this to scare you but rather to make you aware of the potential risk in the broad market right now.
The last piece of technical analysis I want to show you deals with market breadth.
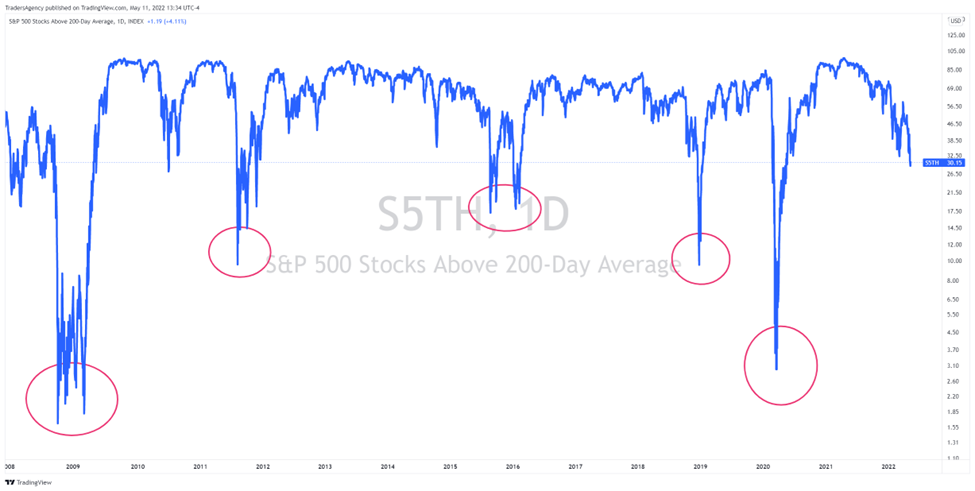
In the chart above, you can see the percentage of S&P 500 stocks that are trading above their 200-day moving averages.
What you’ll notice is that, during big declines, this percentage reading can get pretty darn low. In the 2008 crash and during the pandemic bear market, this figure got down below 3%.
In 2011 and 2018, the reading got below 10%. And in 2015-2016, the percentage fell to under 20%.
Well, even with the current decline, the reading is still around 30% right now.
What this tells me is that there is still plenty of room for more individual stocks to fall before the current selloff runs its course.
Again, I am not trying to scare you out of the market. But I wanted to put some evidence behind my reasoning for building a Watchlist full of short ideas this week.
Until something changes in the market, we’re likely going to continue to skew our ideas to the downside.
With that in mind, stay nimble with your trading.
Waiting for the Bottom
As I noted above, I’m only interested in short trades right now. Until we find a real bottom, I feel this is the appropriate strategy.
And we won’t know for sure that the bottom is in until we start to see massive buying by institutions.
These are hedge funds, pension funds, endowments and other trillion-dollar organizations that are eventually going to start scooping up stocks at value levels.
And when they put their money to work, following their lead can pay off big time.
This is exactly what I focus on in my premium Stealth Trades research service.
So, if you’re interested in giving it a try, click here now to view my latest presentation.
Embrace the surge,

Ross Givens
Editor, Stock Surge Daily
The post Three Big Reasons Why The S&P 500 Could Fall Further appeared first on Stock Surge Daily.


