Good morning, Traders!
The Nasdaq 100 E-mini Futures market (NQ) is rocking and rolling right now! The one-hour timeframe broke above the current up channel, gave us a clear counter trendline break, and is on its way to 16072.25! What does that all mean? Well, follow along in today’s Daily Direction to find out!
Both the long-term and short-term directions are up for the NQ. And with the current counter trendline break bullish into the buy zone, we’re now presented with opportunities to buy the NQ and watch as it continues to rise to new high prices.
With more than +2,100 ticks until we hit the up Fibonacci extension, there’s plenty of room to make profitable trades in the NQ right now. But you won’t see a dime by sitting on the sidelines.
Join me as I take a look at the Nasdaq 100 E-mini Futures setup today:
Daily Timeframe Analysis
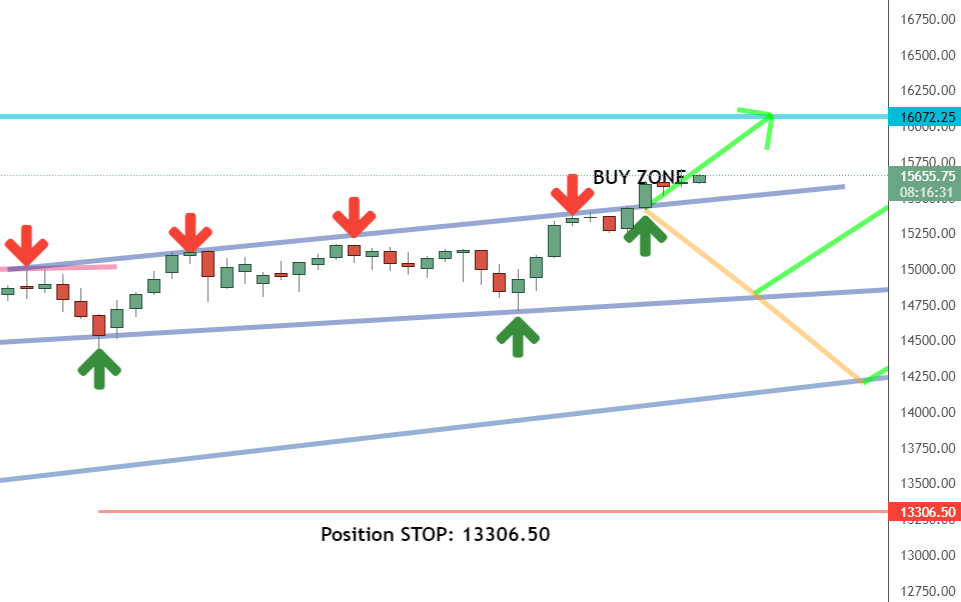
When we look at the daily timeframe for the NQ, we can see that the market is clearly breaking above the current channel. That means the market is ready to head toward higher prices as it begins a bullish push.
One thing we should consider is the fact that the NQ is slightly high at the moment. That means we could see a short retracement before the market then heads back into a rally. But that means we’ll keep looking for low prices in the buy zone along the way!DAILY TIMEFRAME

The long-term direction is up for the NQ

The short-term direction of the NQ is currently up

The NQ has broken the counter trendline and entered the buy zone
Learn more about the Daily Direction Indicators here…

The daily timeframe shows the NQ clearly above the top of the channel, ready to head toward higher prices
Now that we have a clear direction within the daily timeframe, we should turn to the one-hour timeframe analysis and see if it’s the right time to execute our buying strategy for the market. Remember that we analyze the long-term and short-term directions of a market to better understand what the market is doing.
One-Hour Timeframe Analysis
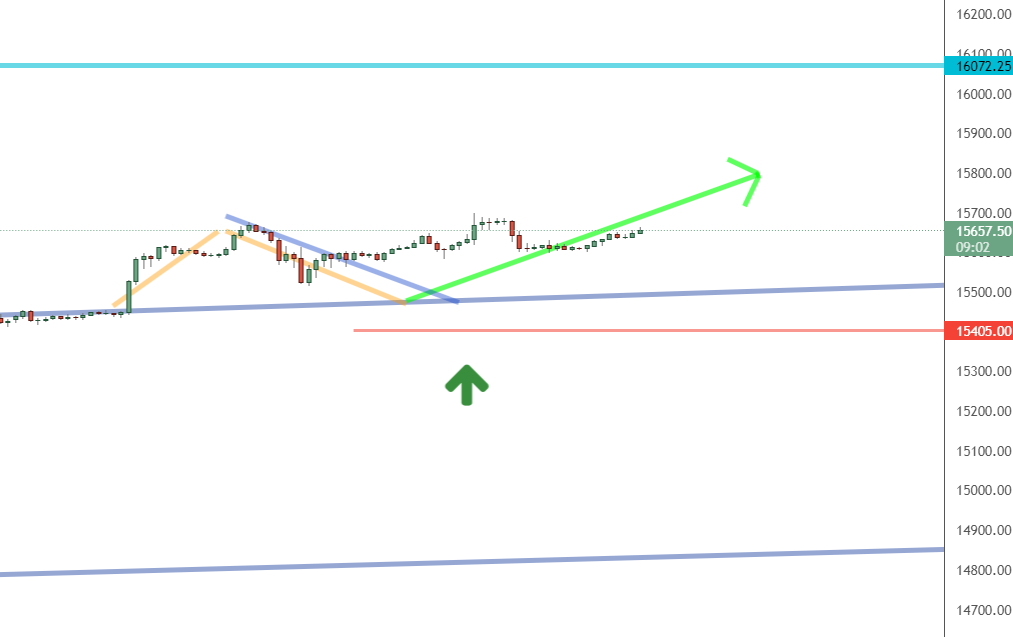
The one-hour timeframe for the NQ looks pretty impressive! We have a very clear counter trendline break, with the market above the channel and making positive movements within the buy zone. We should keep our eyes on this chart as we watch the market continue its current trend. This is where we make our entry and exit decisions.

We see an impressive counter trendline break in the one-hour timeframe for the NQ as the market is clearly making its way to 16072.25
We’re making our way toward the 16072.25 up Fibonacci price point, with plenty of chances at buying the NQ along the way. You can see that there are low price points within the overall upward trend that should allow us to get the NQ at a good price. Don’t forget that the market moves in waves, with the overall direction remaining positive. It’s important that we make that observation if we’re to properly apply our trading strategy.
The Bottom Line
Both the long-term and short-term directions for the NQ are up as the market crosses the counter trendline and pushes bullish. As long as the market continues in the buy zone, we’ll keep a watch on the timeframe charts for opportunities to buy the market at low prices. And that’s the bottom line of how we make a profit trading futures!

Even if we see a retracement along the way, we’re in a good position to trade the NQ as it remains in the buy zone and continues to move toward the 16072.25 price point
But none of this does you any good if you’re still sitting on the sidelines. Learn more about my trading system and my proven track record to see how you can get started today! Timing is everything, so you can’t afford to keep waiting.
Keep On Trading,

Mindset Advantage: Forget About It!
Move on with your trading and leave the past where it belongs…. in the past.
It’s a recurring theme. It happens over and over again. You can feel it the second it comes on. The market is going to do ‘it’ – whatever ‘it’ is – again… to you and your account. The flashbacks start pouring in. It’s impossible not to relive it all.
In an instant, a calm Tuesday morning is now haunted by a trading session ages ago. Just when you thought you would never, ever, ever find yourself in that situation again.
It’s time to move on. Sure, mistakes repeat themselves, but the key to getting past errors and losses of the past is first to embrace them. Own them. Take them as they are. After all they’re yours.  Then move on.
As the great Dr. Seuss said: “Don’t cry because it’s over. Smile because it happened.”
Traders Training Session

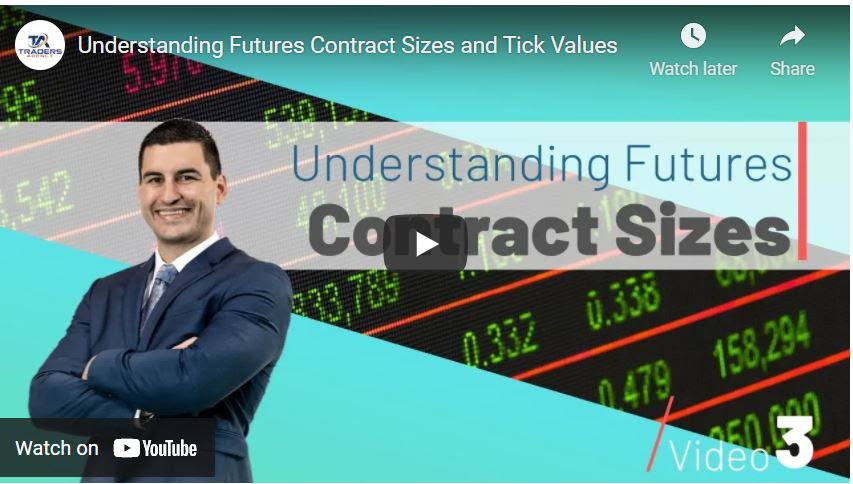
Understanding Futures Contract Sizes and Tick Values
Stay tuned for my next edition of Josh’s Daily Direction.
And if you know someone who’d love to make this a part of their morning routine, send them over to https://joshsdailydirection.
The post This market is rocking and rolling! appeared first on Josh Daily Direction.


