Hello, Daily Direction readers!
We’ve kicked off a new year and a new week of trading futures contracts! Today, we’re looking at the E-mini Russell 2000 (RTY) as we’re actively searching for opportunities to buy the market.
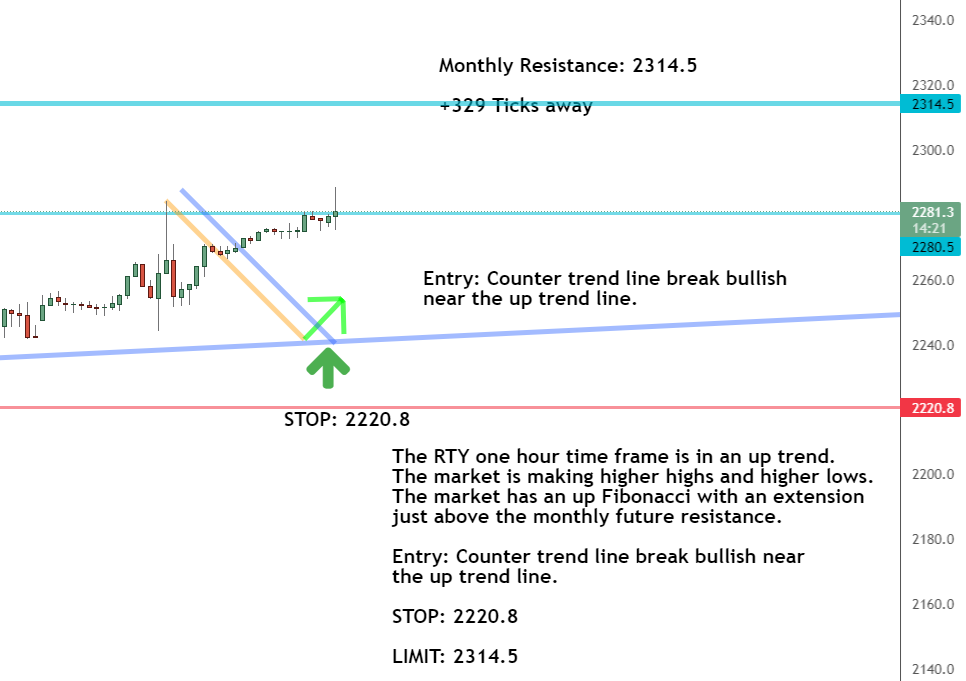
Both the long-term and short-term directions for the RTY are up. The market is currently in an up trend as it makes higher highs and higher lows.
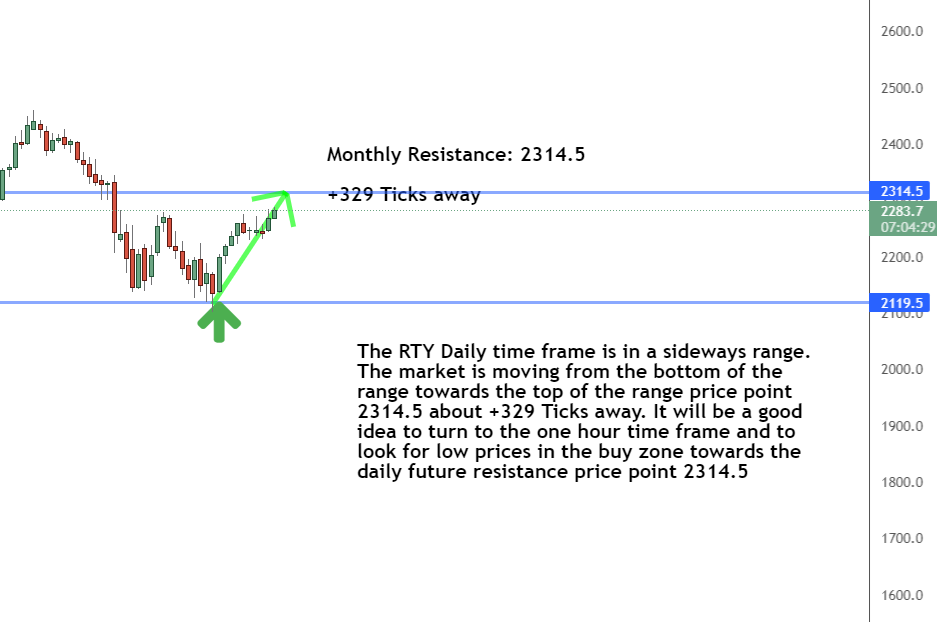
Our up Fibonacci extension is near the monthly resistance price point of 2314.5, so we’ll look for any chances to jump into the RTY and trade it as it makes its way toward the top of the channel. This should give us a +329 tick movement.
We’ll keep an eye on the RTY and make sure it stays above the up trendline. Now’s a good time to familiarize yourself with the difference between our long-term and short-term analyses if you want to get a good setup with this trade.
Now let’s take a look at our timeframe report to get a better idea of what the RTY is doing:
One-Hour Timeframe Analysis
One look at our one-hour timeframe reveals that the RTY has broken the counter trendline within the up trend and is heading toward a higher price.
This is our signal to actively look for opportunities to trade the market. The RTY will continue to make higher highs and higher lows so long as it stays above that up trendline.
Our current stop is 2220.8, while our monthly resistance level is at 2314.5.
It’s a good idea to keep an eye on the one-hour timeframe and to consider zooming down to a 5-minute timeframe as well. Remember to use short-term timeframe charts to look for good spots to buy a futures market.

Learn more about the Daily Direction Indicators here…
The Bottom Line
We’ll continue to look for chances to buy the RTY as long as it stays above the up trendline and keeps moving within the buy zone.
As the market approaches a point of resistance, we’ll look to see if a sell-off occurs. Our timeframe charts will be critical in helping us decide if/when we take a step back from the RTY.
But until that happens, we’ll continue using this setup to make trades within the E-mini Russell 2000.

Without my timeframe strategy, finding trades like we’re seeing in the current RTY setup is difficult and opens one up to making unwise trade decisions.
That’s why it’s time to start utilizing my knowledge and expertise!
Don’t be the one to miss out on this. Follow along as I show you how I find profitable trades within the futures market.
Keep On Trading,

Mindset Advantage: Follow The Data
“Life is 10% what happens to you and 90% how you react to it.”
– Charles R. Swindoll
The market is gonna do what the market does.
You can either get eaten up, or you can take advantage of it.
Really? Who cares where price goes?
Who cares what happens in the news?
Not us.
Use the system.
Follow the data.
Make your trades and make your moves.
Traders Training Session

Stay tuned for my next edition of Josh’s Daily Direction.
And if you know someone who’d love to make this a part of their morning routine, send them over to https://joshsdailydirection.
The post This Is Why Timeframe Charts Are So Important appeared first on Josh Daily Direction.


