
Hey, Ross here:
As we close out the trading week, let’s look at another encouraging sign for the markets.
Chart of the Day
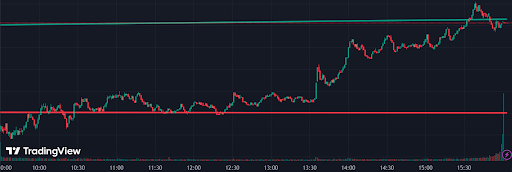
This is the daily chart of the S&P 500 for Thursday. The red line is the 200-day moving average, which I talked about a couple days ago.
Quick refresher: if we look back all the way till 1950, every time the S&P 500 entered bear market territory then bounced back above its 200-day moving average for a month, it has NEVER made new lows.
Currently, the S&P 500 has closed above the 200-day moving average for the past straight 29 trading days. But yesterday was the first time it opened below the 200-day moving average.
Is this a bad sign? Quite the opposite. As you can see, buyers quickly stepped in to support, and the index ended up closing substantially above the 200-day moving average.
This is encouraging – and shows that there are still strong buyers who can keep the rally going.
P.S. Want special trade prospects and potential market moves sent directly to your phone from me? Then just text the word ross to 74121.
Insight of the Day
Being able to “sense” the give and take between buyers and sellers in a market just from a simple chart is a valuable skill.
For many newer traders, a chart is nothing more than a record of an asset’s price at a given time.
But once you’ve spent over a decade in the game, charts take on a whole different flavor. With just a single glance, you can “sense” how the buyers and sellers are interacting – and who’s winning.
This helps in analyzing the broad market movements, like in today’s Chart of the Day. But it’s even more helpful when it comes to looking at individual stocks – especially less-popular ones that don’t receive a lot of analyst or mainstream news coverage.
Because without that sort of coverage, we have to rely mostly on price action. And the better we are at reading the price action to see where it’s likely to go, the more profits we can make.
And of the biggest “trading superpowers” is recognizing institutional money inflows from the price action. Because that’s the kind of thing that can send a stock surging in a short time. Learn more about how to spot these flows here.
Ross Givens
Editor, Stock Surge Daily


