
Good Morning, Traders!
If you’re reading my Daily Direction newsletter, you’ll see numerous important indicators down the right-hand column. These simple symbols provide you a quick snapshot of how our featured futures market is doing for the day.
Daily Direction’s purpose is to provide you with the knowledge you need to execute profitable trades. And the secret to my method is to keep things as simple as possible. That is why these indicators are so crucial when developing a market trading strategy.
I’ve focused this post on providing the fundamentals of each indicator icon to helping you understand what they represent and how you can use them in your daily trading setup.

Daily Timeframe Indicators
The daily timeframe allows us to see the overall direction for a futures market at a day-to-day level:

Green Up Arrow: Indicates that the overall direction for the daily timeframe is up. That means the price movement is currently positive. The market is making higher highs and higher lows. We can expect money-making opportunities in the long term.

Red Down Arrow: This means the general direction for the daily timeframe is down. We’re likely to hold off on making long-term trades as we wait for the market to pivot back toward a positive direction.
One-Hour Timeframe Indicators
The one-hour timeframe gives us an hourly snapshot of a market’s price movement. We use the one-hour timeframe chart to plan our entries:
Green Up Arrow: The current short-term trend as revealed in the one-hour timeframe chart is up. The price of the market continues to track upward, giving us confidence that we can find opportunities to buy the market and make profitable trades.
Red Down Arrow: Our one-hour timeframe chart reveals that the short-term direction for the market is down. This could be due to a retracement (temporary price dip) or a total reversal in the market. This is when we should be cautious with our entry strategy.
The Bottom Line Indicators
The Bottom Line portion of our Daily Direction indicator section gives an overall review of whether the market has made a solid U-turn toward a bullish run or down to a bearish sell-off:
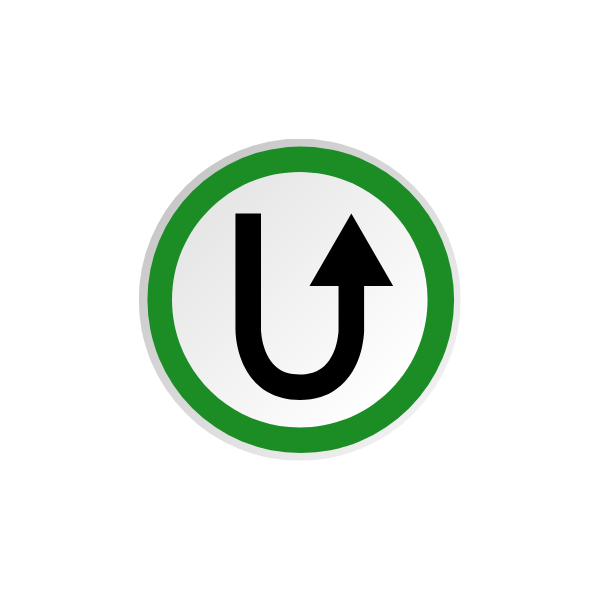
Green Up U-turn: The market has U-turned from a previous sell-off/retracement and is preparing to make a bullish run into a buy zone. We should prepare our entry strategy and look for opportunities to buy the market.
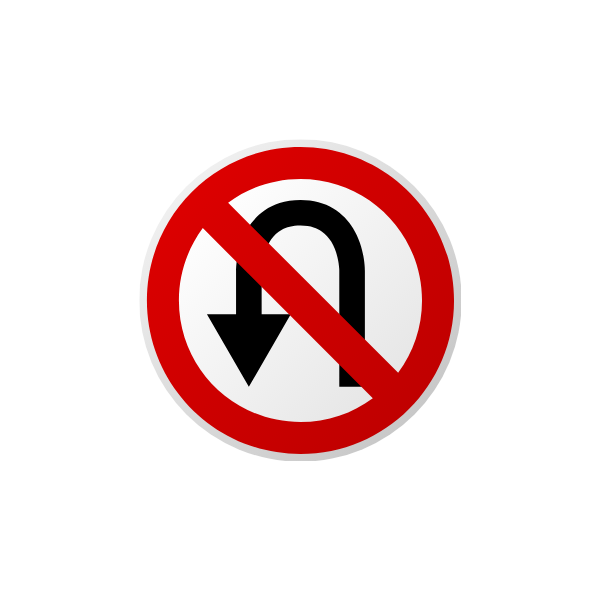
Red Down U-Turn: Indicates the market has started a sell-off from a previous bullish rally and is headed down to a new low price. It’s best to wait and see how low the market will go before examining our buying options.

Neutral: This indicator tells us that the market is currently not in a position to U-turn. It’s either trading sideways, in a solid bullish run, or still finishing out a bearish sell-off. This is a good time to focus on our current position within the market.
Because they connect to the market we’re presently watching, these indicators perform best when paired with my comprehensive analysis in each of my Daily Direction articles.
They allow you, the reader, to quickly assess the overall direction of the futures markets we trade without having to follow complicated charts and graphs. I hope this informative article helped you better understand how my newsletter works. Be sure to check out my other free resources on futures trading!
Keep On Trading,

Stay tuned for my next edition of Josh’s Daily Direction.
And if you know someone who’d love to make this a part of their morning routine, send them over to https://joshsdailydirection.
The post The Market Indicators to Help You Trade Better appeared first on Josh Daily Direction.


