Good morning, Traders!
It’s been an interesting few days in the market. Right now, we’re looking to the Nasdaq 100 E-mini futures market (NQ) to see if it can break the counter trendline and move bullish again.
So far, we’ve seen it break into the sell zone with a false reversal, the move back into the buy zone while creating an up Fibonacci. Now, we’re waiting to see if the market can break bullish and give us an opportunity to buy the market.
This is where our trendlines come in handy. Without them, it would be difficult to see when the NQ moves back toward the Fibonacci extension.
Now let’s take a look at the timeframe charts to see how we can prepare for the NQ’s current movements:
Daily Timeframe Analysis
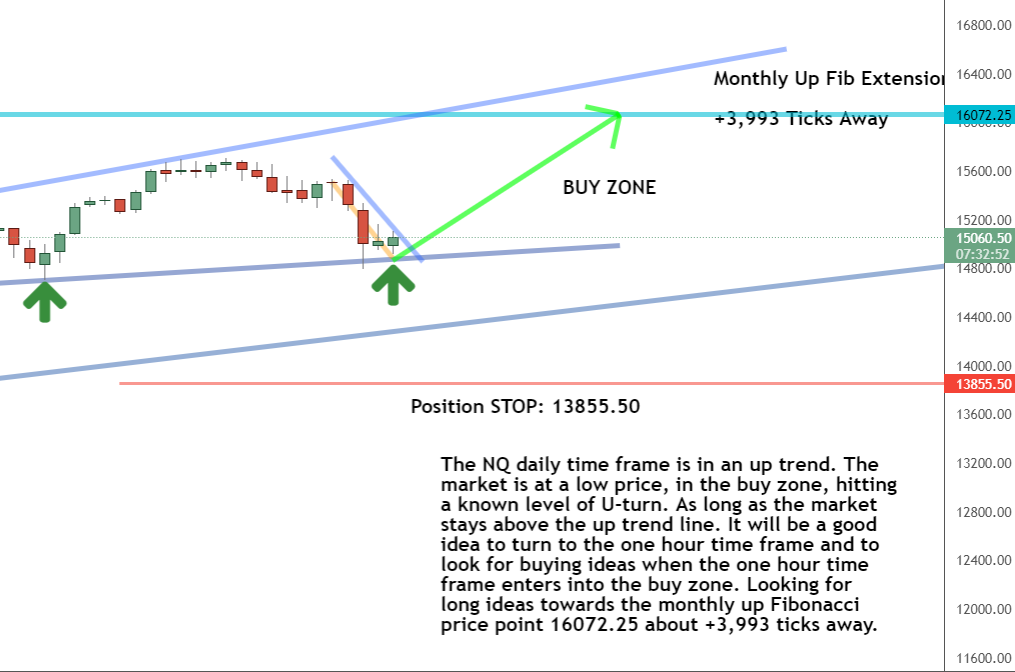
The daily timeframe is in a nice up channel, meaning if the market U-turns and breaks bullish, we could see a nice bullish rally. The market would push toward the up Fibonacci of 16072.25
However, if support fails and the market pushes through that bottom channel line, we could see a sell-off that will drive the price down.

The long-term direction is up for the NQ

The short-term direction of the NQ is potentially up as we wait and see

We’re waiting to see if the NQ breaks bullish or breaks support
Learn more about the Daily Direction Indicators here…

The NQ could is set for a nice bullish rally if support can hold
The art and science of predicting future price movement can be tedious. But my strategy is designed to accomplish it with ease. That’s why my timeframe charts are so important to preventing traders from making the wrong call on a trade setup!
One-Hour Timeframe Analysis
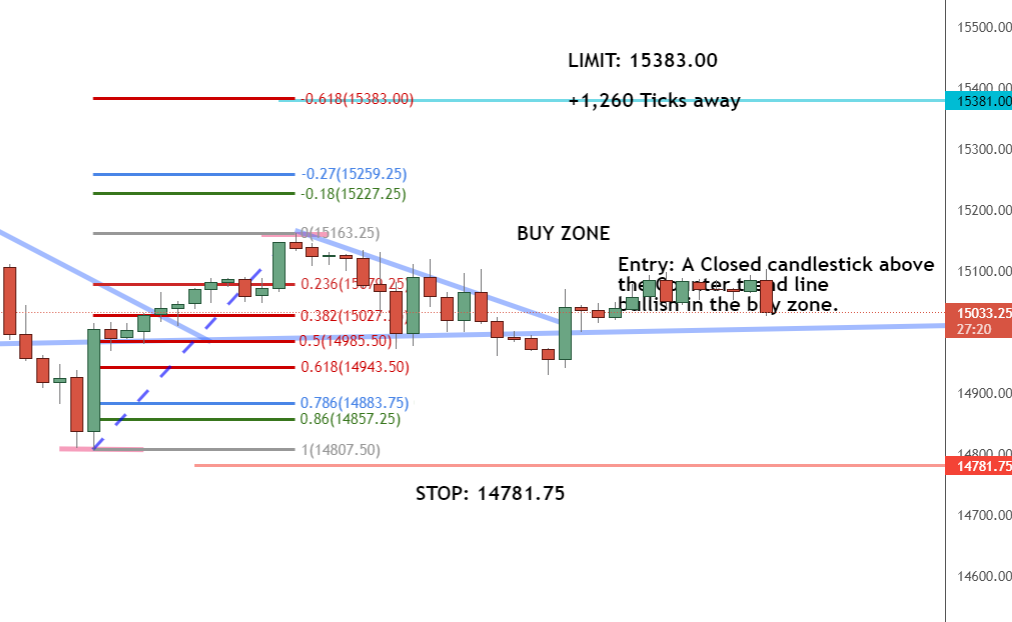
The one-hour timeframe shows the NQ just barely breaking the counter trendline into the buy zone and pushing sideways across the chart.
So long as the market can stay in the buy zone, we can watch and see if it starts to push toward the up Fibonacci of 15383.0. While it remains in the buy zone, we can look for opportunities to execute our buy-in strategy for the NQ.

So long as the NQ stays in the buy zone, we can watch for it to push toward the up Fibonacci limit
All of this requires patience as we watch how the NQ reacts. Market movements can get tricky, so we want to make sure that we’re in a good position before making any decisions about buying or selling.
The Bottom Line
The timeframe charts will play a critical role in determining how we approach the NQ. The entire point of my strategy is to give you the information you need to make wise decisions in the market. Without that strategy, you’re risking your money.

Following the timeframe charts is an important part of getting the right setup for the NQ
And this is why following my futures trading strategy can help you make the right trading choices. You’ll see when it’s profitable to enter a market and when it’s wise to stay away. Now’s the time to get on board if you’re ready to make smart trading decisions today. There’s no reason to keep putting it off!
Keep On Trading,

Mindset Advantage: Accept
It’s not the market. It’s not your indicator. It’s TRADING.
Let it go. The first step toward consistent profits comes when you accept the reality that losses will occur. Prices have a mind of their own at times. The institutions are at the wheel. The sooner you accept this, the more progress you’ll make.
Look at the past, but don’t stare. Accept what’s happened and move on.
Target tighter entries. Get the heck out of those losers you’re hanging on to.
Accept. And start to enjoy trading.
Traders Training Session

Understanding Futures Contract Sizes and Tick Values
Stay tuned for my next edition of Josh’s Daily Direction.
And if you know someone who’d love to make this a part of their morning routine, send them over to https://joshsdailydirection.
The post Sometimes waiting is the most important thing appeared first on Josh Daily Direction.


