
If you’ve been following my trading strategy, you’ll know that I rely heavily on timeframe charts to make futures trading judgments.
So today, I want to teach you about the indicators and setups I use when preparing my charts.
Dealing with all of the data for trading might be difficult, but properly setting up my charts is a critical part of becoming a successful trader.
Without timeline charts, we wouldn’t know how or when to engage a market.
And while it may look intimidating at first, I’m here to show you how simple it is to use my charts for any trade, regardless of your experience level.
Let’s have a look at how I build my timeframe charts so you too can get started with technical analysis…
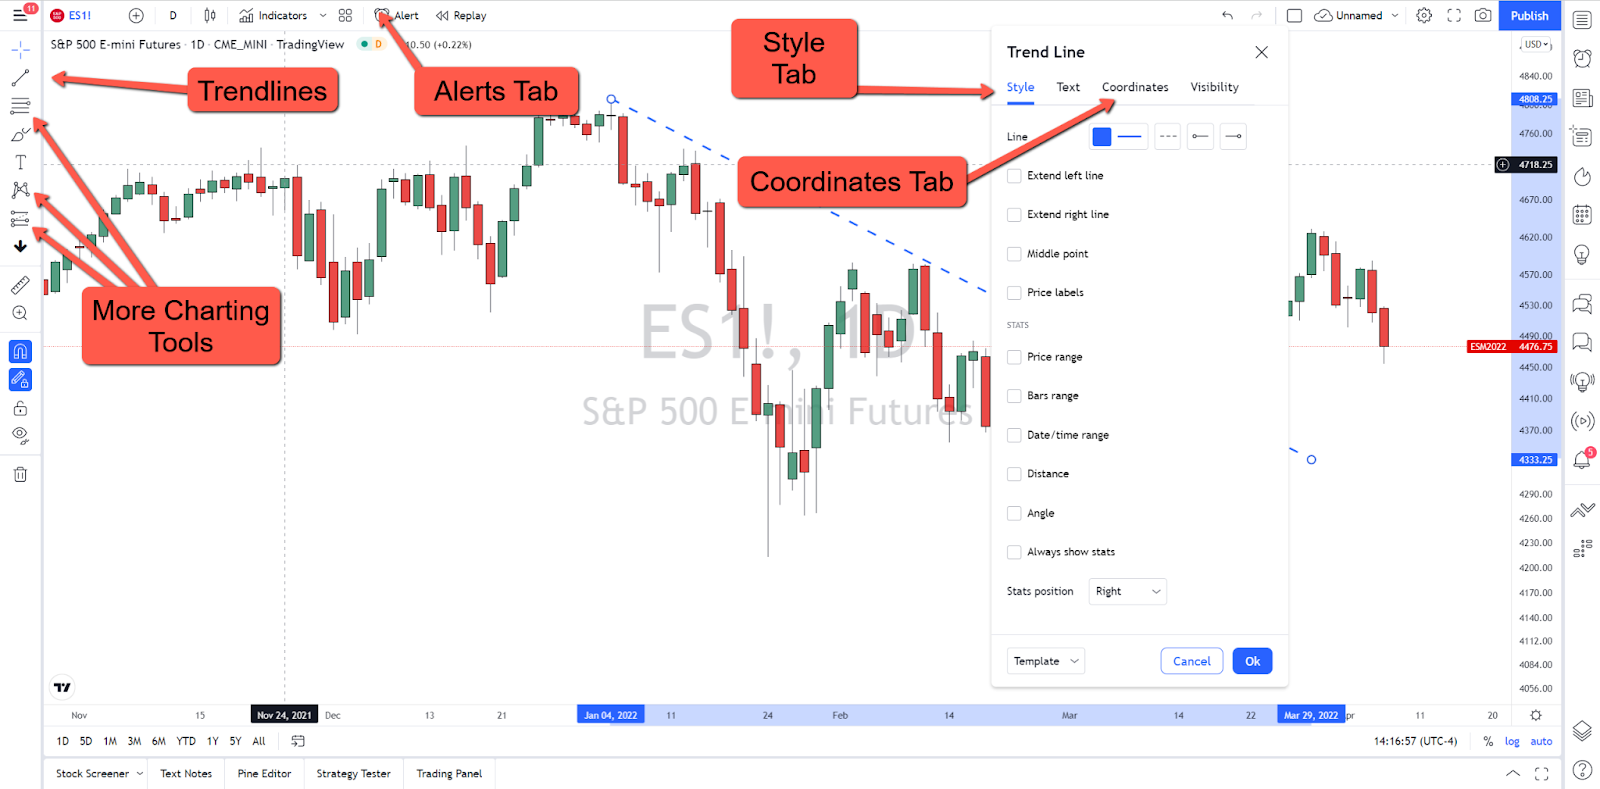
Setting Up Your Trendlines
Trendlines: Trendlines are one of the most important parts of my strategy.
In TradingView, the online tool I use to build my timeframe charts, the trendlines icon can be found on the top left side of the screen.
Click on the icon to apply it, and then scroll over the chart with the mouse to the desired location. When a starting point is decided, click once and click again on the endpoint we’ve determined.
Next, use the mouse to highlight the line until both endpoints are visible, and then right-click on it. An immediate list of choices will pop up…
Select the format to change a variety of things. These functions are available on all tools with minor tweaks depending on the tool selected.
Here are the functions of each tab under the trendlines tool…
Style Tab: The style tab permits a multitude of modification options. Some examples are line design, color change, line extensions, applying numerical data and even adding arrows to lines’ ends.
Coordinates Tab: The coordinates tab allows traders to view and edit where the line is set to begin and where it is meant to end. The tab is also the best way to see specific numbers that allow users to properly calculate the line slope.
Alerts Tab: The alerts tab gives you an option to play a sound, send an email, show a popup or send a text in the event a preset condition should be met.
More Charting Tools
Pitchfork: The pitchfork icon is located directly below the trendlines icon. We use it to create a trend channel to follow the overall direction of a market.
To set it up, click on the screen three times. The first click is for the median, while the succeeding two are for the outer variables.
Right-click when you’re done to exit and to ensure you don’t end up creating unintentional drawing tools. As with the previous tool, users can play around with various functions simply by selecting the style tab.
Remove lines, change up the color, switch line thickness or even go from a solid line to a broken one.
Long Position: Next, we’ll look to use the long position indicator. It allows traders to set an entry point and assume a long position from that point.
We click on the icon once where we want to start our position. We make it a point always to right-click afterward to avoid adding more to the items we just drew.
Manually adjusting the profits or loss section can be done by dragging the top or bottom circle. Dragging the circle allows us to move the entire box.
We format this by scrolling over the box, right-clicking, and then selecting “format.”
The Bottom Line
Most people know me as a futures trader, but I also dabble in plenty of individual stocks.
And I have a new way of picking out opportunities in “marked stocks”… To learn more, check out the P.S. below.
For more on the markets as well as trading education and trading ideas like this one, look for the next edition of Josh’s Daily Direction in your email inbox each and every trading day.
I’ll be bringing you more of my stock and futures contract trading tutorials as well as some additional trading ideas.
And if you know someone who’d love to make this a part of their daily trading routine, send them over to joshsdailydirection.com to get signed up!
Keep on trading,

P.S. Stock markets may be unsettled, or even bearish. But that doesn’t mean that there aren’t opportunities…
All it takes is riding the coattails of a stock after it’s been “marked.”
To learn more about how to identify and trade these specific stock opportunities, click here.
The post Prepare Your TradingView Charts for the Week Ahead appeared first on Josh Daily Direction.


