Good morning, Traders!
I’m currently watching the Russell 2000 (RTY) as the market has bounced off support and is headed toward the top of the channel. This is a great opportunity to make some money before the next sell-off!
As the market continues to rise toward resistance, we should keep an eye on the one-hour time frame to find opportunities to buy the market at low prices within the buy zone.
But we also should prepare for a retracement as the RTY approaches resistance. Remember that resistance is the point where buyers back off and the price of the market falls back toward support.
To learn more about how market movements work, be sure to check out my video on the topic. It’s information you’ll need to fully understand how my setups work.
Now let’s go over our timeframe charts to take a closer look at the RTY:Daily Timeframe Analysis
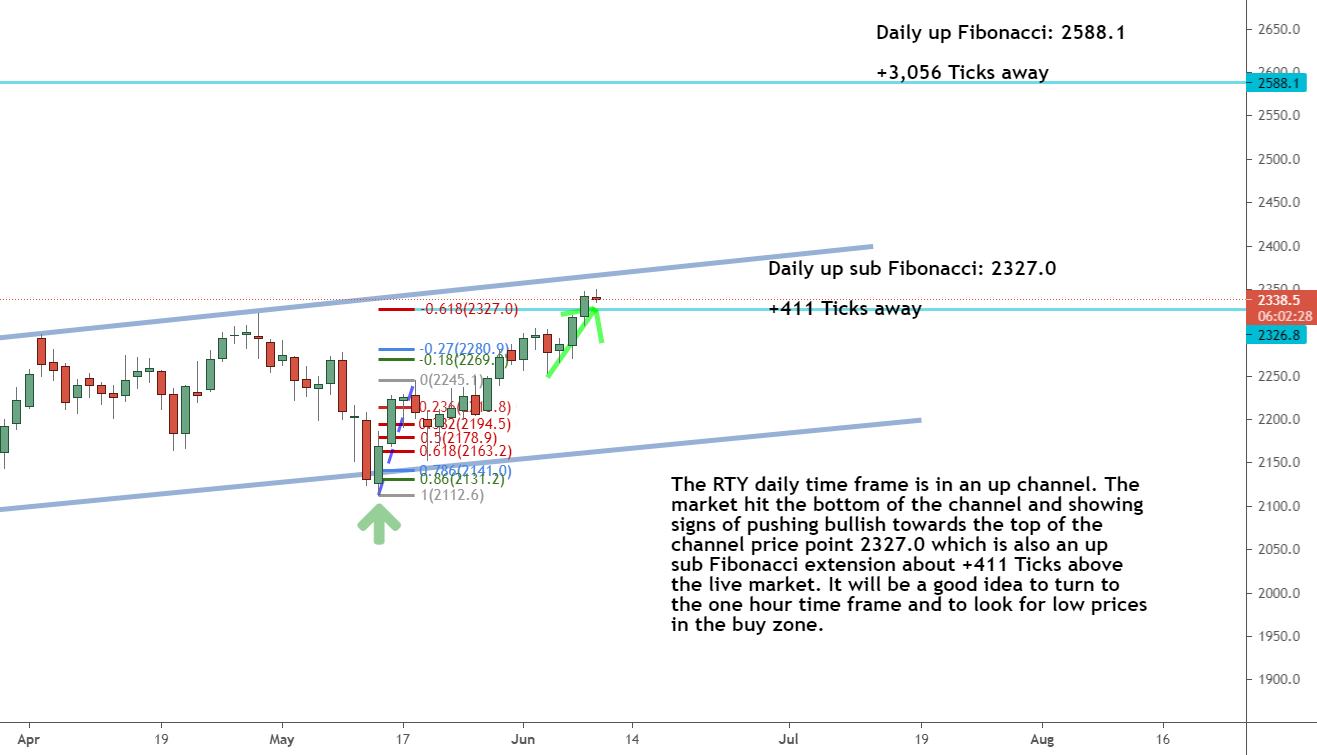
The daily timeframe for the RTY shows that the market is still in an up channel, with the market steadily moving toward the top of the channel (upper grey line). DAILY TIMEFRAME

The direction within the daily timeframe is up
1-HR TIMEFRAME

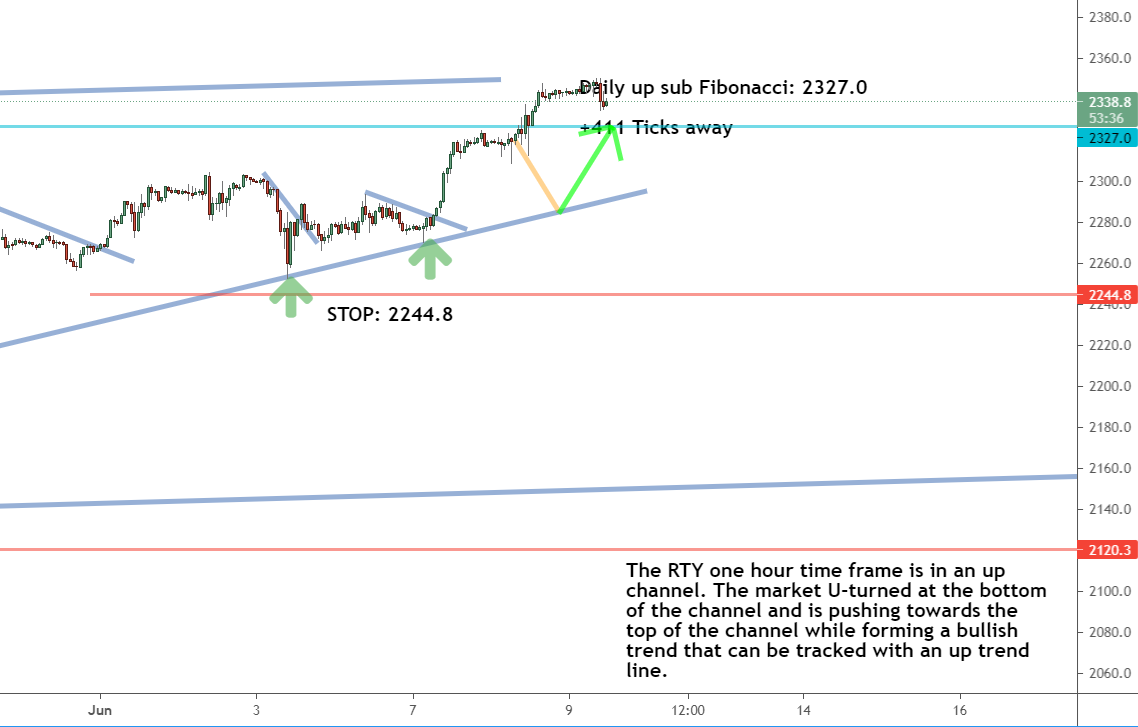
The current direction for the one-hour timeframe is up
THE BOTTOM LINE

The U-turn direction remains up

The daily timeframe direction for the RTY remains up as the market continues to move toward the top of the channel (top grey line)
As the price continues to fulfill the Fibonacci extension, we should keep an eye on the market as it approaches resistance. In the meantime, let’s turn to the one-hour timeframe and look for opportunities to enter the RTY within the buy zone.
| Recommended Link:We can’t believe why almost no one is talking about this. It’s potentially the BIGGEST investment news of the decade. Today, we’ll show you how accessing a little-known portal in your brokerage account… Is the key to potentially amassing a quick fortune. You can start with a minimum average investment of just $500… And turn it into a mind-blowing $50,000 payout! All because the Chicago Mercantile Exchange (known as the “Merc”), the giant 171-year old trading marketplace, effectively turned the investing world on its head. Overnight, they created a lucrative loophole so big it lets thousands of ordinary, hard-working Americans earn huge sums of extra cash. |
One-Hour Timeframe Analysis
When we turn to the one-hour timeframe, we see that the market continues its bullish run toward the top of the channel that can be tracked with an up trend line (middle grey line).

The RTY one-hour timeframe remains up as the price continues to rise within the channel (upper and lower grey lines.) The market continues to move bullish toward the top of the channel (upper grey line). We’ll watch for opportunities to buy the market as it continues to move up
As long as the market stays about the trend line, we can look for opportunities to buy the RTY at low prices as it continues its bullish run toward the top of the channel.
Now’s a good time to check out my article on how to properly draw trend lines. It’s a skill that can greatly improve your trading strategy!The Bottom Line
We’ll watch the RTY in both the daily and one-hour timeframes as the market approaches the top of the channel.
We can trade the RTY as it remains in a bullish rally. As the price gets closer to fulfilling the Fibonacci extension, we should prepare for a price drop as the market hits resistance. But that’s just part of how the market works! We’ll just wait for a rebound off of support and watch as the market returns to the buy zone again.

The short-term and long-term directions for the NQ are clearly up. We’ll keep an eye on our timeframe charts as we look for opportunities to buy the NQ
Now that we’ve looked at this setup for the RTY futures market, it’s time for you to take the next steps toward being a successful trader! Don’t miss out on this opportunity. There’s so much more to learn, but you have to make the decision now to get started!
Keep On Trading,

Mindset Advantage: Balance
When it comes to your mindset for trading, you’ll find that your ability to cope with the markets, bad trades, good trades – whatever – has more to do with how you spend your time outside of trading. More specifically, how much balance you have.
In fact, of your total state of readiness 10% may have to do with charts and price levels. The other 90% has to do with how rested you are. How focused you are. How happy you are.
Find a balance that works for you and begin the path towards happy trading.Traders Training Session


