The goal of The Daily Direction is to give you the information you need to make winning trades.
And the key to my technique is to keep things as straightforward as possible.
That’s why I’ve focused this post on providing the fundamentals of each indicator icon you will see on our time frame charts.
Continue reading to see what they represent and how you can use them in your daily trading setups…
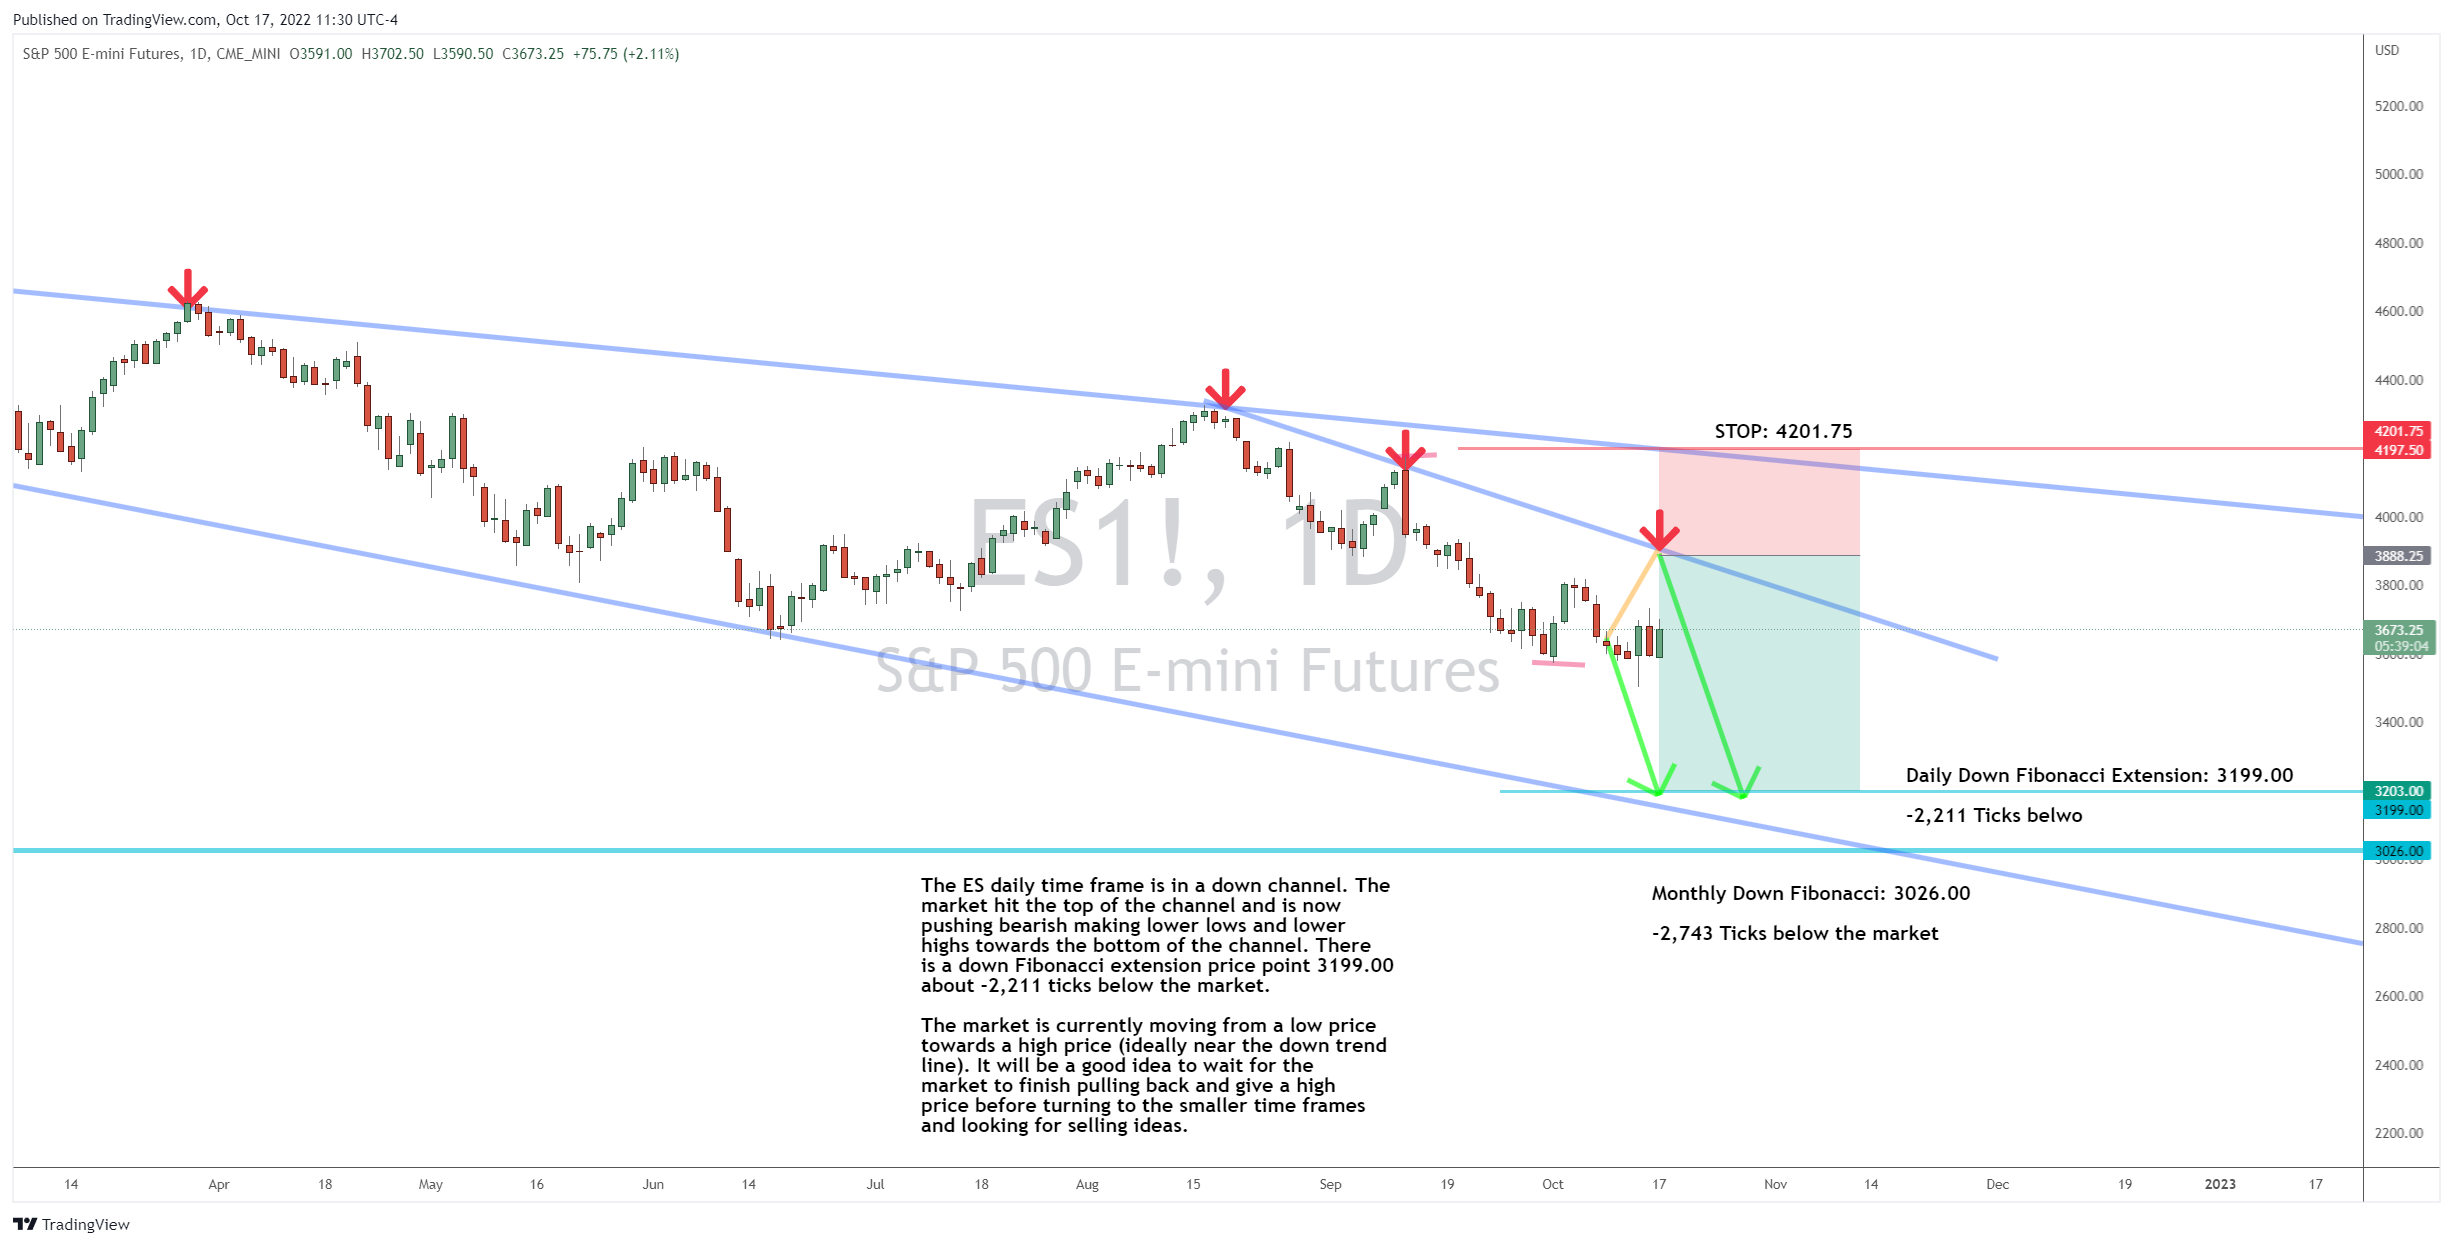
Daily Timeframe Indicators
The daily timeframe allows us to see the overall direction for a futures market at a day-to-day level:


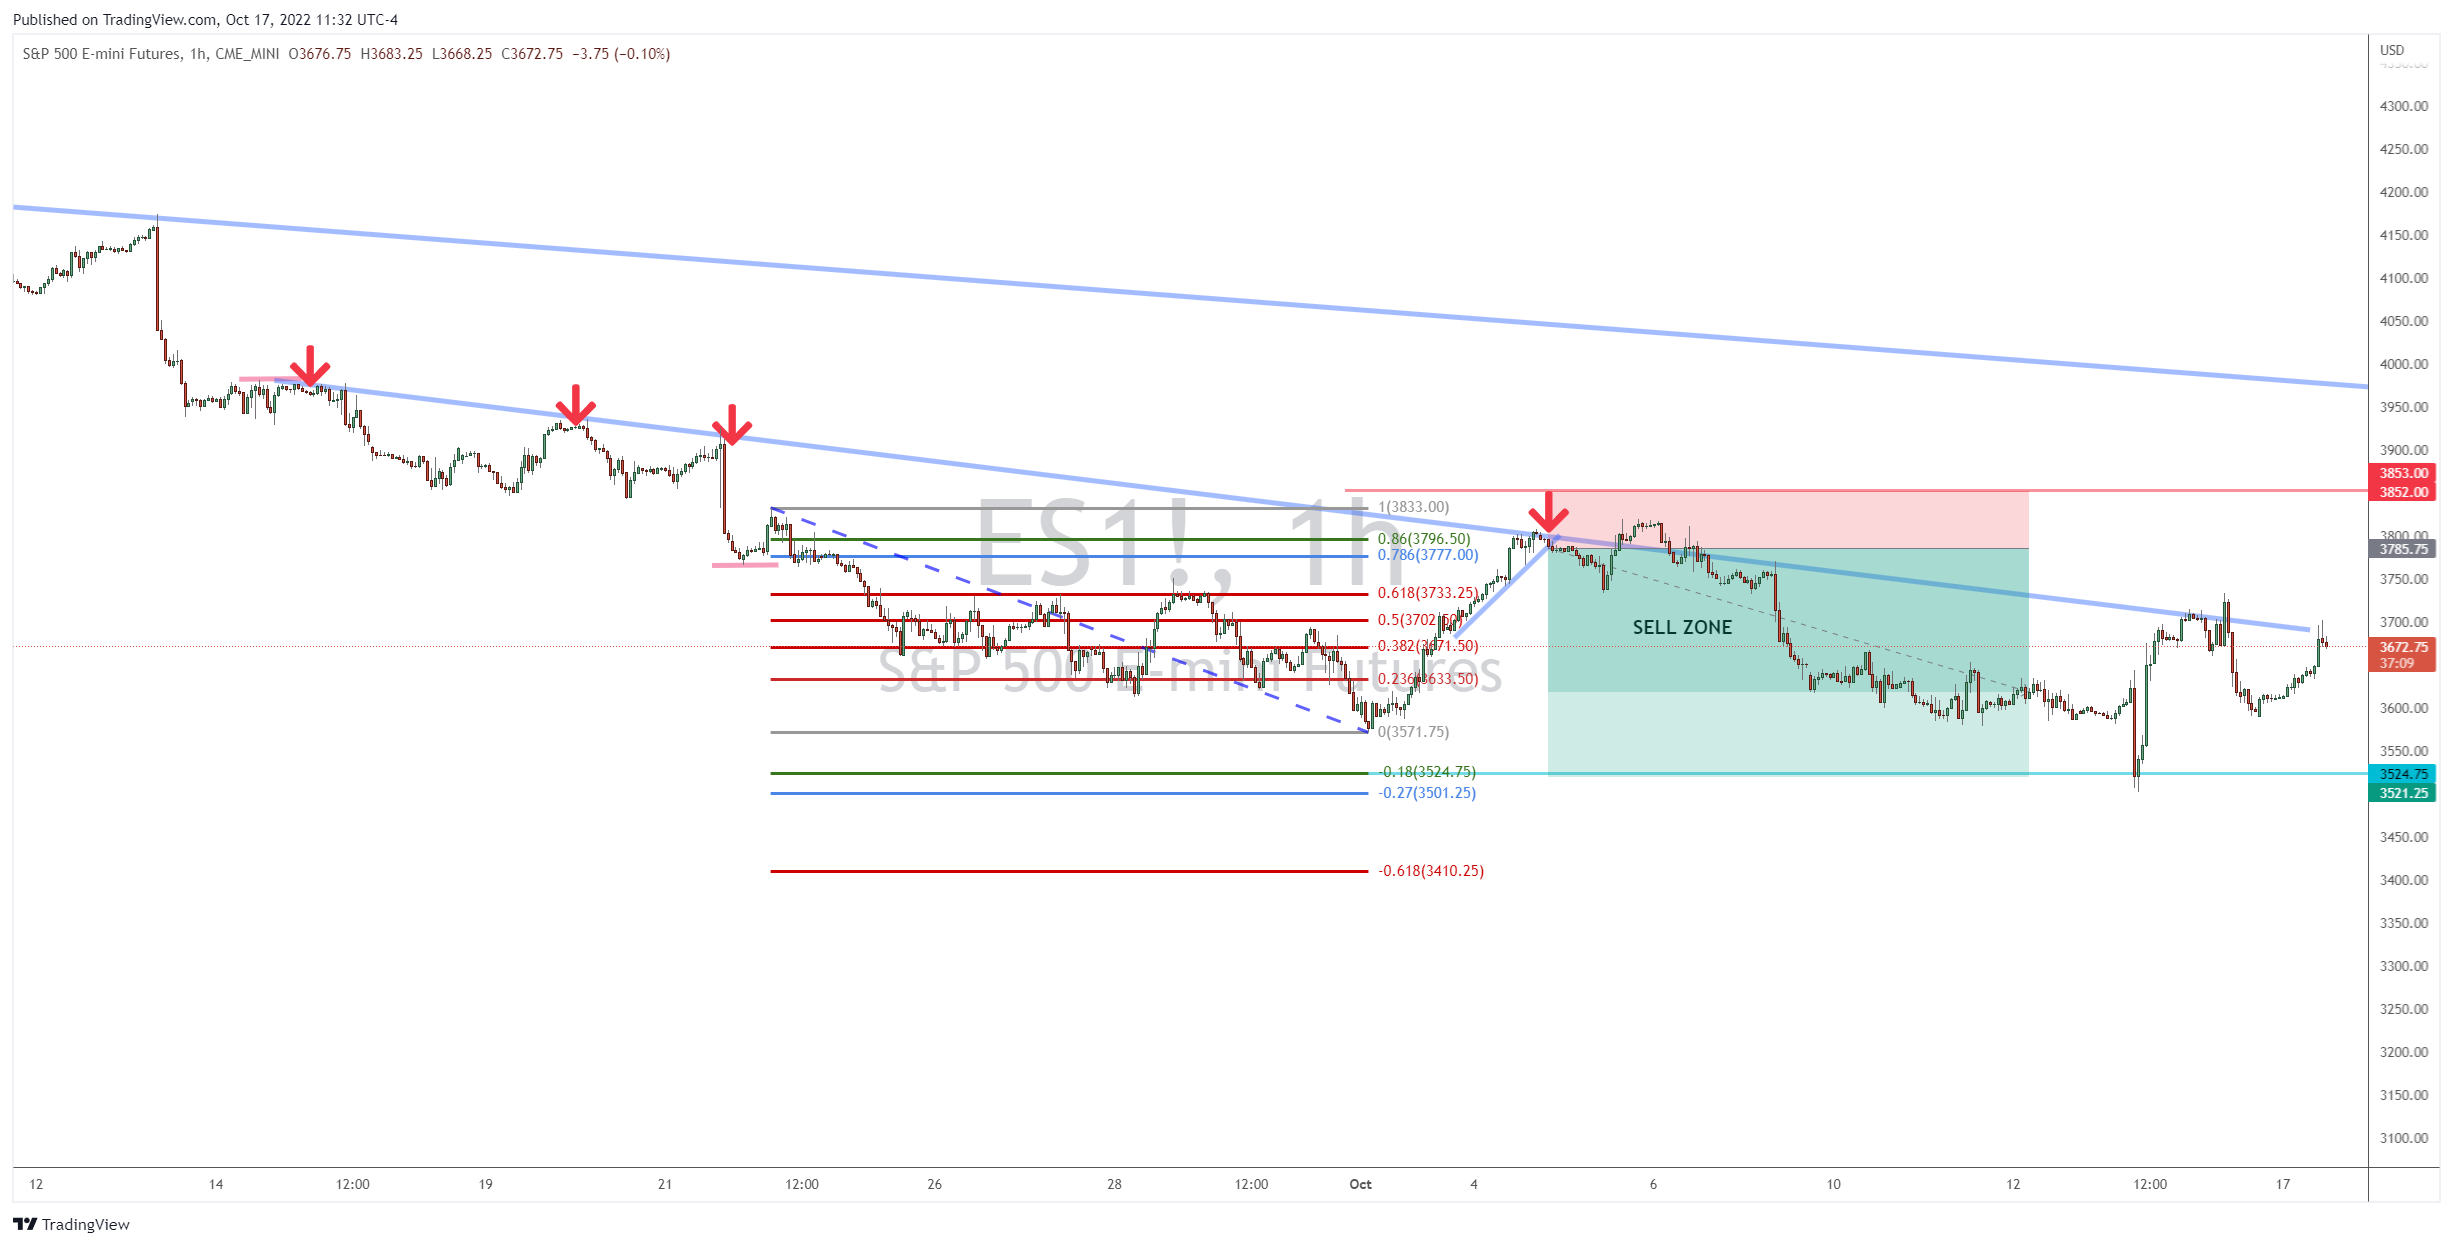
Hourly Timeframe Indicators
The one-hour timeframe gives us an hourly snapshot of a market’s price movement.
We use the one-hour timeframe chart to plan our entries…


The Bottom Line
Once you’ve got the daily direction down, consider checking this out…
My colleague and equities pro Ross Givens has come up with a brand new strategy that aims to deliver weekly gain opportunities without ever holding a single stock.
If you’re interested, check out the important P.S. below…
For more on the markets as well as trading education and trading ideas like this one, look for the next edition of Josh’s Daily Direction in your email inbox each and every trading day.
I’ll be bringing you more of my stock and futures contract trading tutorials as well as some additional trading ideas.
And before you go, head on over to the Traders Agency YouTube channel for breaking market news, live trading sessions, educational videos and much, much more!
Keep on trading,

P.S. My colleague and expert stock trader Ross Givens just unveiled his brand new “rapid cash” strategy that is totally market neutral.
It doesn’t matter if a stock goes up or goes down… With this strategy, Ross can set up his trades to win in either direction.
The post How We Find the Daily Direction appeared first on Josh Daily Direction.


