
Trading the markets is never easy.
“Mr. Market” is out to fool as many investors as possible on a daily basis…
Especially traders who are new to the game and aren’t quite sure what to watch out for.
This is why having a trading plan is absolutely crucial to your long-term success.
Personally, I look to some of the greatest traders of all time for tips on how to create a strong trading plan.
People like Paul Tudor Jones, who reminds us why only losers average down on their losing trades…
Folks like Mark Minervini, who tells us once a secular market leader puts in a major top, there’s an 80% chance it will decline by 50% and a 50% chance that it will decline by 80%.
And of course, Warren Buffett, who says, “You’ve got to be prepared when you buy a stock having them down 50 percent or more and be comfortable with it.”
But these are just some of the overarching principles that go into a serious trading plan.
When you dive further into the world of technical analysis, there are lots of telltale signs that can help investors identify big breakouts ahead.
Technically Speaking
If you’ve been a reader of Stock Surge Daily for a while now, you likely know that I am a big fan of using volume as part of my technical trading strategy.
You can see the green and red volume bars at the bottom of the chart below, which measure how many shares traded on a given day.
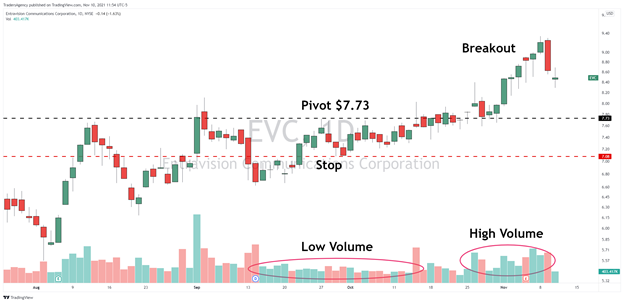
I wanted to revisit Entravision Communications Corporation (EVC), which was part of the Oct. 11 Watchlist, because it is a great example of how to use volume to your advantage.
From mid-September to early October, EVC was showing a period of lower-than-usual volume. At the same time, price was being compressed into a narrowing range.
This let us know that the selling had been exhausted. The profit-taking period was over, and new supply was no longer coming to market.
I noted in the Watchlist that a pivot had formed at $7.73 and that I would use the Sept. 29 low as a stop.
The stock proceeded to slowly drift higher through that pivot level and eventually made a strong breakout on high volume heading into November.
From $7.73, bullish volume accelerated further, and the stock rallied as much as 20.8% before profit-taking set in.
This was a textbook breakout and a great example of how to use volume in your trading.
But this isn’t the only way to use volume to your advantage…
Another Way to Use Volume
Houghton Mifflin Harcourt Company (HMHC) is the Boston, Massachusetts-based learning company that was founded all the way back in 1832.
It appeared on the Oct. 11 Watchlist along with EVC.
At the time, I told you this about the stock:
With a Surge Score of 99/100, HMHC is the Lamborghini of stocks. It is in the elite top 1% of stocks outperforming all others in the market.
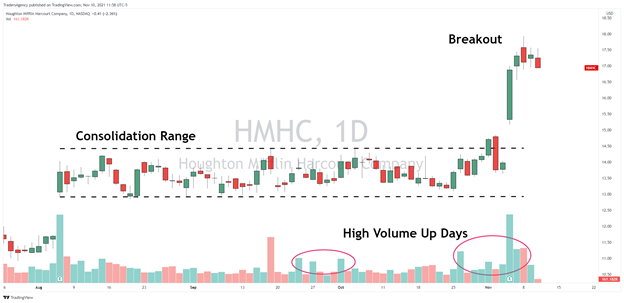
After an earnings gap higher in early August, shares have been consolidating in the textbook compression pattern with clear resistance.
Note the volume over the last two weeks. Down days saw very little volume while positive days experienced much higher volume.
This is a good sign, as it is likely indicative of further institutional accumulation. In other words, the big players are still buying it.
I will be looking to buy HMHC on a breakout to new high ground.
As you can see in the chart above, HMHC was indeed in a textbook consolidation between $13-$14 or so. It lasted for about three months before the big breakout happened.
And perhaps even more amazing than the 25% move at the peak of the recent breakout is how we got tipped off by the action in the volume bars.
When I made the comments above, the first couple of volume bars circled on the chart were already there and pointing to institutional accumulation.
But then, a few candles before the breakout, we saw another large green volume bar and a quick move towards the top of the range.
This was a great tell that a big move was coming.
And despite a brief pullback on low volume, the move was made with a massive volume spike on the gap higher out of the consolidation range.
Remember… the key takeaway here is that we were looking for a bullish volume pattern.
Sure, there was a spike of red volume during the consolidation, but a pattern of red volume days never materialized.
On the other hand, we saw that the bulls were coming back to this stock over and over again, increasing the chances for a potential breakout to the upside.
Suggested Reading
Finally, if you’re new to Stock Surge Daily or just want a refresher on my other key strategies, be sure to revisit some of my favorite articles…
I think these and my other articles can help you get an edge on Mr. Market and improve your trading.
Embrace the Surge,

Ross Givens
Editor, Stock Surge Daily


