
With the US stock market still sky high, everyone is looking for a way to tell if and when the party will be over.
I’ve come across an economic data indicator that appears to be very esoteric – but has an uncanny historic back testing success in calling out trouble.
And today, I’m going to present it to you in a very straightforward fashion so that you can get a real handle on if and when the stock market will be in trouble.
Of course, as I’ve written in these missives as well as presented in my live coaching sessions, including my session yesterday, even in down markets there are plenty of surge stocks to buy that work and will continue to work.
The stocks for this week are prime examples and can be found in the Watch List.
For this week’s full Watch List, click here.
Time the Market – the Scientific Way
It’s an indicator… An indicator that has warned investors before every major market correction for the last 40 years.
You read that right. Every. Single. One.
It’s not a chart pattern. And no, I’m not trying to sell you anything.
This indicator is completely free for anyone to use.
Who created it? The Federal Reserve.
When we think about the Federal Reserve, most investors focus only on monetary policy, primarily changes to its target range for the federal funds rate.
This is the “changed” or “unchanged” announcement that typically triggers a quick and violent move in the stock market.
The Board of Governors meet behind closed doors eight times a year to discuss the economic outlook and make important policy decisions.
These decisions can have immense impacts on capital and debt markets, which is why Wall Street hangs on every word.
But the Fed does a lot more than this…
It produces economic research and data that is some of the best in the world. Teams of economists produce a mountain of in-depth studies and reporting.
And each of the district banks of the Federal Reserve is charged with doing specific studies that feed into the building knowledge base of the overall full membership of the Federal Reserve.
They study everything: Industrial production and capacity utilization, financial incentive analysis and its effects on healthcare outcomes, correlations between home equity withdrawals and automobile purchases.
The Federal Reserve website archive is a data nerd’s dream.
And one of the best and most user friendly can be found at the Saint Louis Federal Reserve.
Its database covers most to all of the Federal Reserve data via its website that is free to all. It can be accessed right here.
Needless to say, most investors don’t read all of these reports. They couldn’t even if they wanted to.
Who has the time?
Besides, the guys on the Goldman Sachs (GS) derivatives desk aren’t overly concerned with Maria Tito’s report, “Welfare Evaluation in a Heterogeneous Agent Model: How Representative is the CES Representative Consumer”.
I fell asleep on the first page…
But hidden beneath layers of obscure federal research is a number.
This number, computed weekly by the Federal Reserve Bank of Chicago, “provides a comprehensive weekly update on U.S. financial conditions in money markets, debt and equity markets and the traditional and ‘shadow’ banking systems.”
In other words, it tells investors how tight or loose the money supply is.
It’s called the NFCI, an acronym for National Financial Conditions Leverage Subindex.
And I’m about to show you why this number is more powerful than almost any other for those looking to avoid the next market collapse.
The NFCI has a baseline reading of zero. At this level, conditions are said to be on par with long-term averages.
Positive values indicate conditions that are tighter than average while negative ones represent looser financial conditions.
Readings have been as high as 4.5 and as low as 2.0.
IMAGE: https://www.screencast.com/t/hFx7suxL
Chicago Fed National Financial Conditions Leverage Subindex — Source: Federal Reserve Bank of Chicago
The NFCI indicator has three subindexes: risk, credit and leverage.
The one you want to watch is leverage. It aggregates debt and equity measures to show how far investors are stretched.
The construction of the NFCI is a little complicated. Everything the Fed does seems to be.
But using it is incredibly simple.
Here’s How It Works
Increasing risk, tighter credit conditions and declining leverage, all things that send this indicator higher, are consistent with tightening financial conditions.
Tightening financial conditions are known to be bad for the stock market.
This is why above average NFCI readings are valid warning signals for a potentially dangerous stock market.
This was my hypothesis when I began researching the indicator almost 10 years ago.
But until I overlaid the NFCI readings with a 40-year chart of the S&P 500, I had no idea how powerful this indicator was going to be.
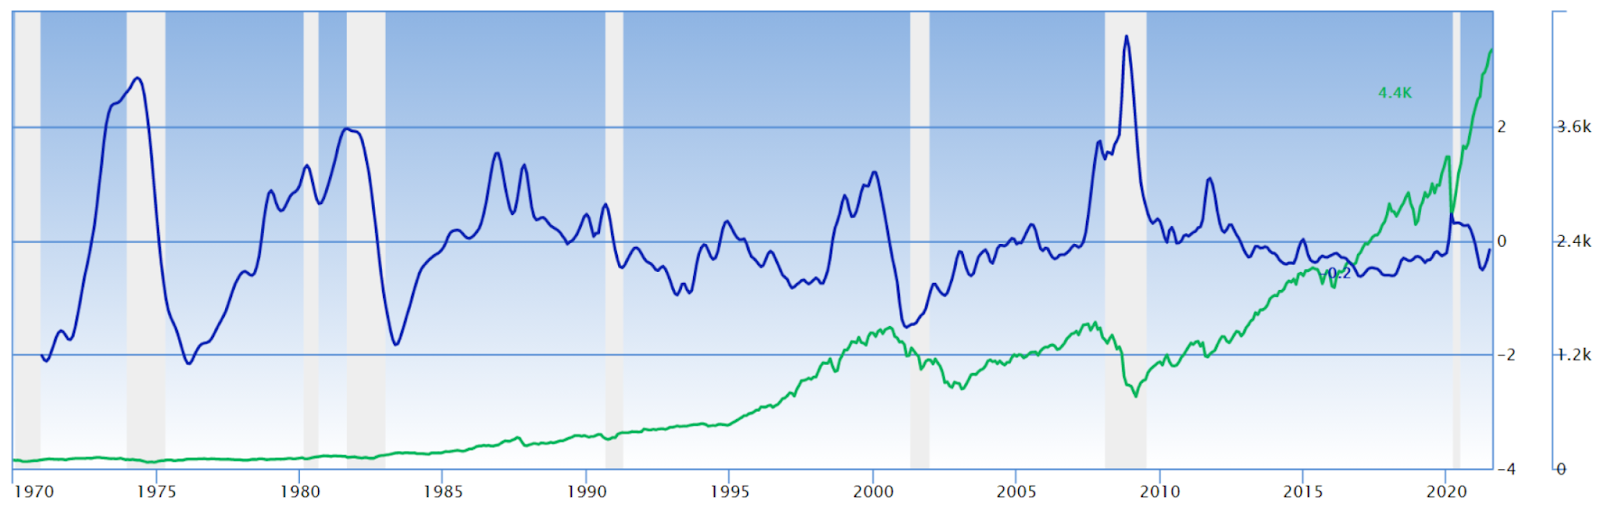
Chicago Fed National Financial Conditions Leverage Subindex & S&P 500 Index — Source: Federal Reserve Bank of Chicago
Since 1973, every single major market correction has been preceded by an NFCI reading of greater than 1.0.
The following chart is an overlay of the NFCI against the S&P 500 index. Recessions are highlighted in silver.
As you can see, each NFCI reading above 1.0 is followed by a significant down move in the equity market.
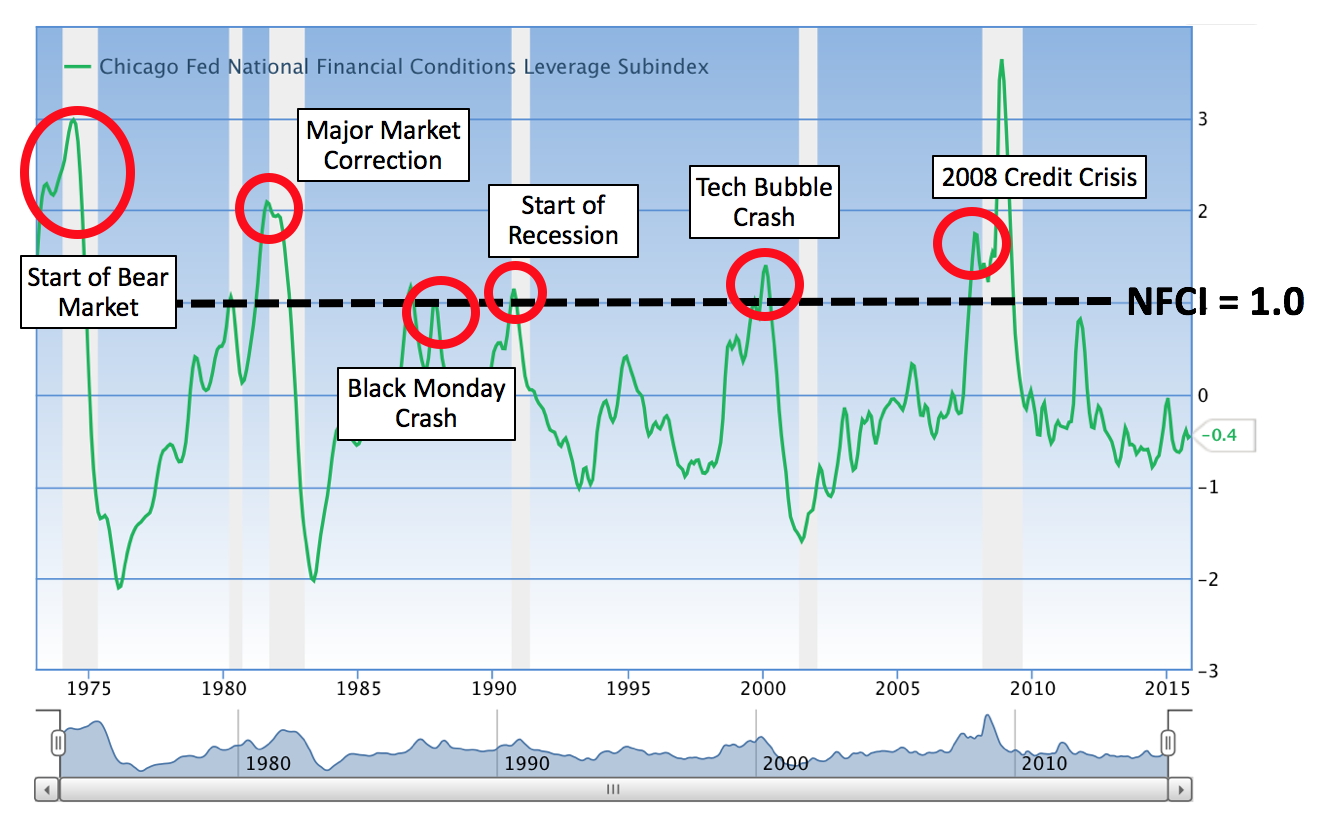
Chicago Fed National Financial Conditions Leverage Subindex & Market Crashes — Source: GuruFocus & Federal Reserve Bank of Chicago
The amazing thing about this indicator is its uncanny accuracy. Only one false signal has been given in the past four decades, and it is hard to call it completely false.
The signal arrived in 1986 and turned out to just be early.
A few months after a reading above 1.0, we experienced the Black Monday crash of 1987.
IMAGE: https://www.screencast.com/t/HeBfEvrZMwUP
Chicago Fed National Financial Conditions Leverage Subindex & Black Monday Crash — Source: GuruFocus & Federal Reserve Bank of Chicago
The indicator was again sounding its alarm in the months leading up to this catastrophic event, however, with readings above 1.0.
In fact, the NFCI made a three-year high signal of 2.07 just three days before the Dow Jones Industrial Average lost 22% in a single day on Oct. 19, 1987.
(This reading cannot be seen in the chart as it only lasted for a few days.)
This powerful signal can be found on the Federal Reserve Bank of Chicago website right here.
In my opinion, the NFCI is one of the clearest signals for an impending bear market or major correction.
In the last 40 years, with the exception of the COVID bear market, the stock market has never lost more than 20% of its value when the NFCI was below 1.0.
But when the NFCI climbs above +1.0, equity markets are no longer safe.
Regardless of economic outlook, investors should take extreme caution and consider moving their assets to cash or another alternative.
And of course, I recently posted a primer on using a specific market option when you want or need to hedge your own stock portfolio.
It was in the issue titled Options to Protect Your Portfolio, published on Thursday, July 22.
I suggest you give it a read if you haven’t done so already…
One Last Thing
Thank you for reading and subscribing to Stock Surge Daily. And we do hope that you’ve been cashing in on so many of the surging stocks that we’ve been presenting each and every week in the Watch List. And again, the full writeups on all of the stocks in the Watch List can be accesses right here: (TKTK).
All of the stocks that we present are vetted by our proprietary Stock Surge Indicator (SSI) system. And again, you can get the full rundown on how this works with the free download of the special report: The Magic of the SSI right here: (TKTK).
We have taken the SSI system to the next level with our newer Insider’s Edge product.
Insider’s Edge focused on the component of the SSI system of insider buys. Insiders have the definitive information on their companies and their stocks – so following their lead when they buy can provide some major advantages in trading stocks.
Yesterday I did a special live coaching session on insider buys that you can watch the replay right here: (TKTK).
If you’ve made a dime from the stocks inside Stock Surge Daily – you owe it to yourself to try Insider’s Edge. For a special offer and further information on Insider’s Edge, click here: (TKTK). And if you have any questions, please call our team at 888-483-5161.


