
Good Friday, Traders!
This has been a tough year so far for the general US stock market.
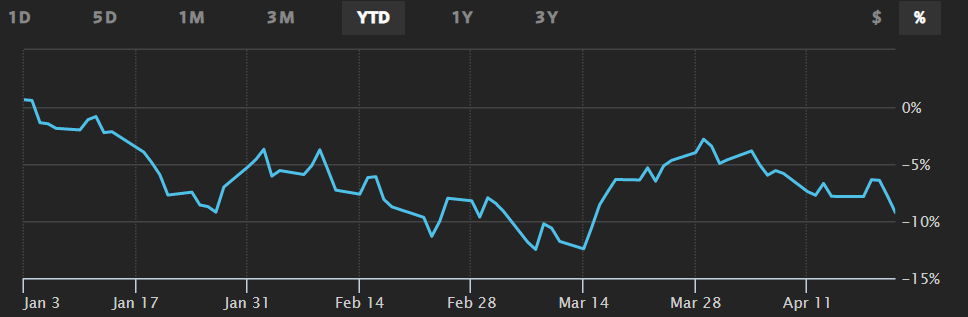
The benchmark S&P 500 Index has dropped in price by over 9%. And there are plenty of analysts that aren’t the most optimistic for the turnaround.
The arguments against a higher stock market include rampant inflation that shows few signs of abating as well as a Federal Reserve that is increasingly expected to tighten monetary policy both more quickly and more severely.
And of course, not helping the market is the ongoing Ukraine-Russia conflict.
But, consumers that make up the biggest overall contributor to the US economy and its gross domestic product (GDP) continue to be flush with cash and ample job opportunities.
They also have been showing a willingness to take advantage of credit for additional spending.
And there are plenty of industries that are gaining from both more demand and investment, including minerals and agriculture as well as manufacturing and other sectors.
So, today, let’s take a good look at the S&P 500 Index to see if there are perhaps opportunities for both a U-turn and price advancement again for this year.
And while we are not in this market right now, it pays to continue our research and analysis to find a potential entry again at cheaper levels before the market begins to move.
The S&P 500 Setup for a Potential Turn
This morning, we took a good look at the S&P 500 Index in its futures contract form (ES).
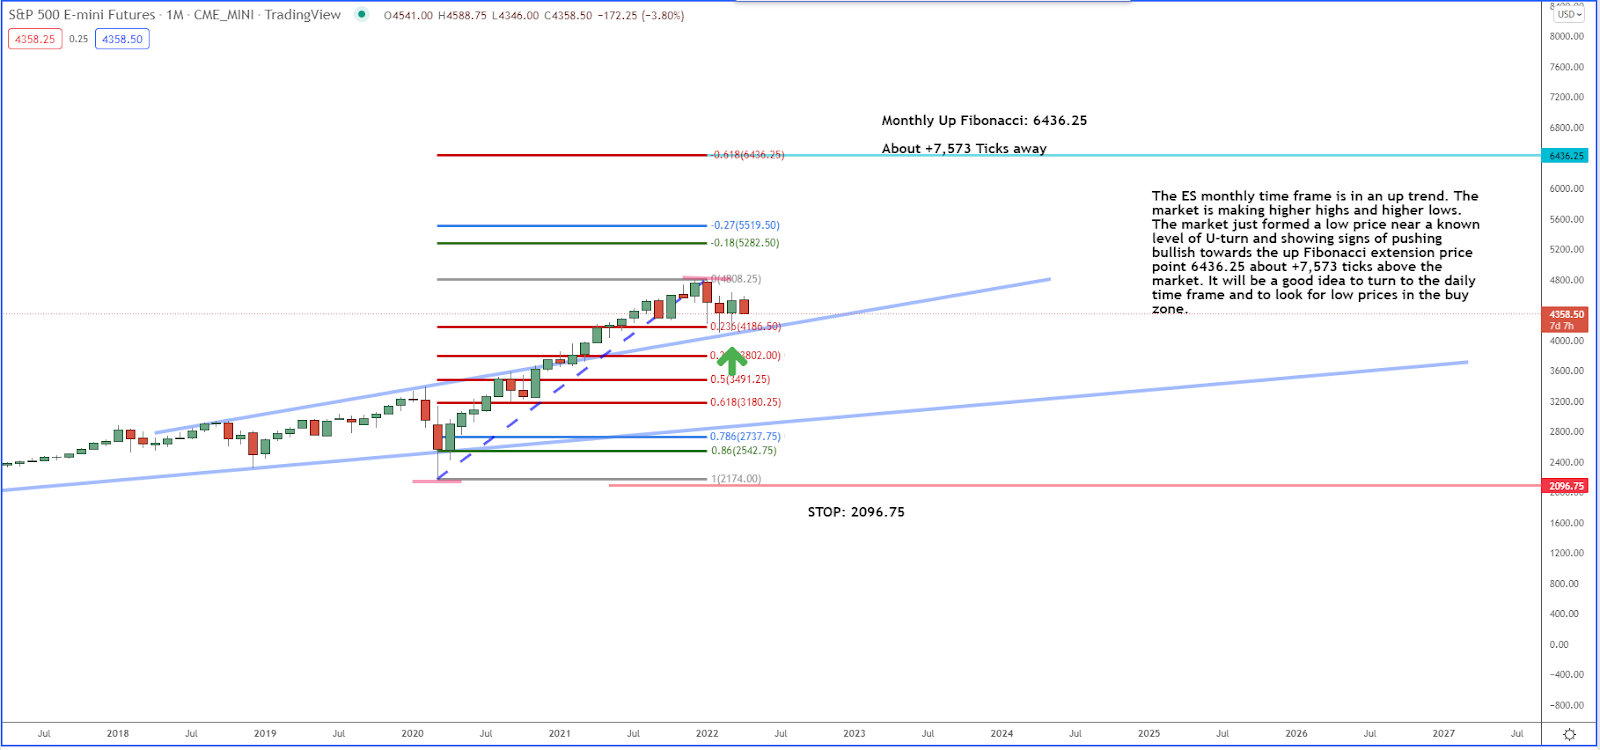
First, let’s look at the monthly chart for the ES contract.
The ES monthly time frame was in an up channel. The market broke above the top of the channel and is now at a low price above the up channel.
There is an up Fibonacci with an extension price point 6,436.25, about +7,573 ticks above the market.
If the market stays above the top of the channel, we will look for signs of the market going bullish. We will turn to the daily time frame and look for low prices in the buy zone.
And here is how this shows up in the monthly price chart…
So, on a monthly chart basis, there may well be a potential set up for an entry. But, let’s now move to look at the daily chart.
The S&P Daily Chart View
When we move to the daily time frame chart, we also see some further potential for both an entry and a profitable trade for the ES contract.
This is due because the ES daily time frame broke the daily downtrend line and entered into the buy zone.
However, the market pushed bullish and took out some past highs and then started pulling back.
Then the market created an up Fibonacci with an extension price point 4,941.00, about +2,038 ticks above the market.
The market is at a low price. If the buyers are to take control we should see signs of the market U-turning bullish and breaking above the short term downtrend line.
However, at this time we are out of the market and wanting to get in.
Here is how we see this in the daily chart:
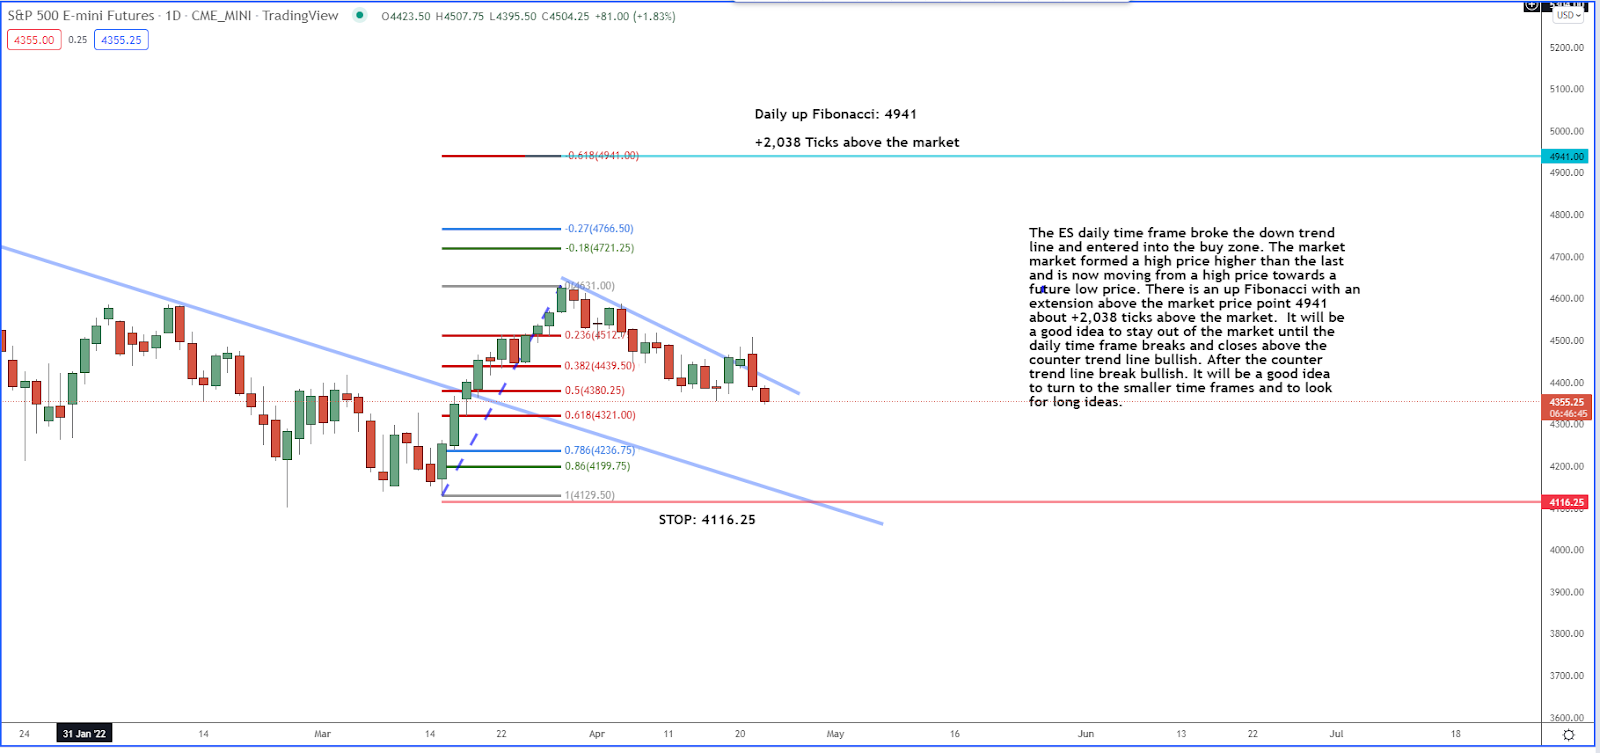
We are waiting for a daily low to form and the market to break and close above the short-term downtrend line before looking for long ideas.
When Action Is Warranted
Now, just as noted above, we are not in the market right now. But we continue to research and analyze the core benchmark US stock index and its futures contract market.
This provides subscribers to War Room and Futures Edge the ability if and when the market sets up for an entry to get in for potential profits earlier and not just in catch-up mode like from other analysts. Bottom Line
For more on the markets as well as trading education and trading ideas like this one, look for the next edition of Josh’s Daily Direction in your email inbox each and every trading day.
I’ll be bringing you more of my stock and futures contract trading tutorials as well as some additional trading ideas.
And if you know someone who’d love to make this a part of their daily trading routine, send them over to joshsdailydirection.com to get signed up!
Keep On Trading,

P.S. My colleague Anthony Speciale here at Traders Agency continues to work diligently on trading ideas behind the scenes in the petroleum market. And these ideas have the ability to set up a “pipeline” of profits…
To learn more directly from Anthony, click here.
The post How the Stock Market May Set Up for a Big Turn appeared first on Josh Daily Direction.


