
The S&P 500 index is the benchmark for the US stock market.
It tracks a collection of 505 stocks with a total market cap of over $40 trillion.
And the index is market-cap weighted, which means companies with higher market capitalizations are more heavily weighted in the index.
For example, Apple (APPL) — with a $2.9 trillion market cap — makes up 6.9% of the index weighting…
Microsoft (MSFT) — with a $2.6 trillion market cap — makes up 6.3% of the index weighting…
Amazon (AMZN) — with a $1.7 trillion market cap — makes up 3.6% of the index weighting…
Tesla (TSLA) — with a $1.1 trillion market cap — makes up 2.2% of the index weighting.
And so on…
But as I’ve noted recently, the market has been extremely weak under the surface for months now…
Hiding in Plain Sight
Right now, just 5% of stocks in the S&P 500 Index make up over 40% of the overall weight.
In other words, AAPL, MSFT, AMZN, TSLA and a few other mega-cap stocks like Nvidia (NVDA), Meta Platforms (FB) and Alphabet (GOOG) determine what the index does.
If many or most of those stocks are up, the index is usually up for the day.
When these stocks are down, the index is usually down for the day.
And this becomes a problem for traders because it masks what’s really happening under the surface of the market…
While the mega-cap stocks have been pushing the index higher, the average stock in the index is actually down significantly.
Here’s the S&P for the year to date…
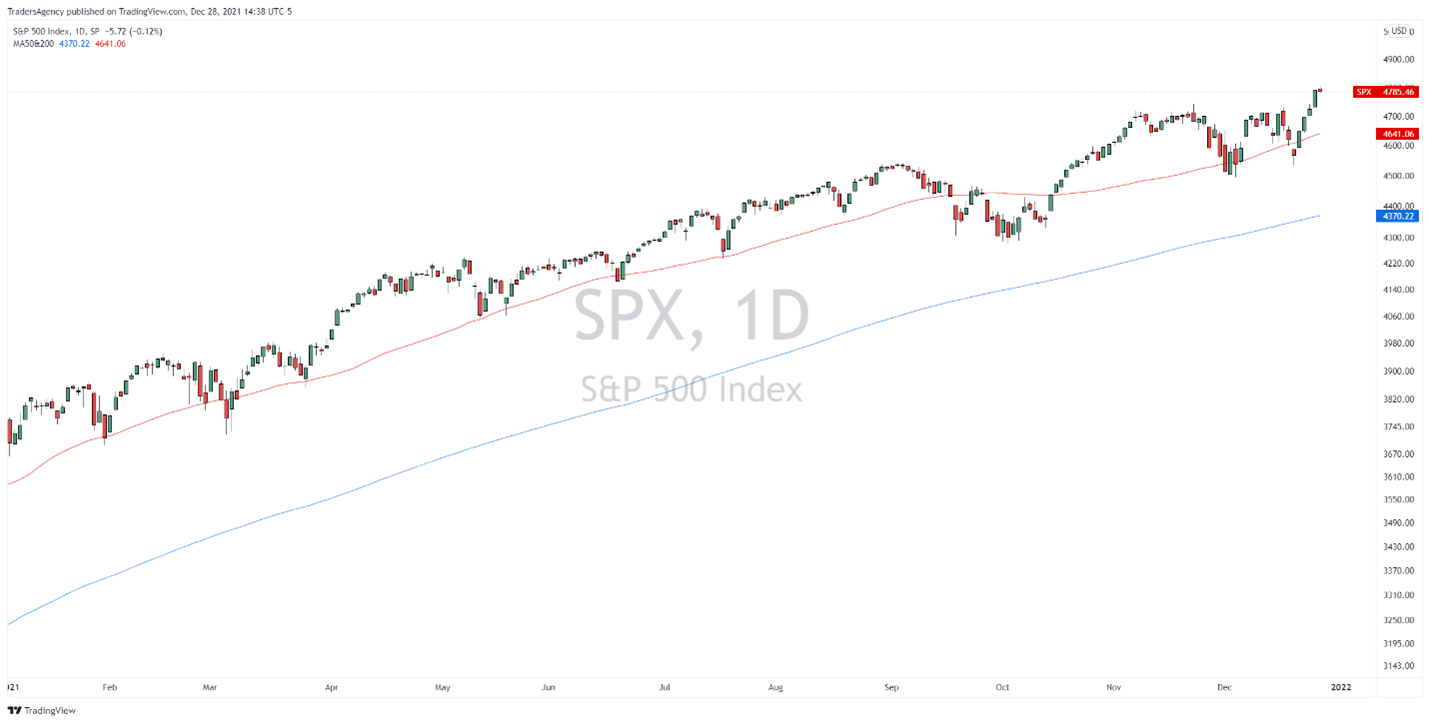
As of this writing, the index is up 29.4% in price for the year with only very modest drawdowns along the way.
Now, check out the graphic below…
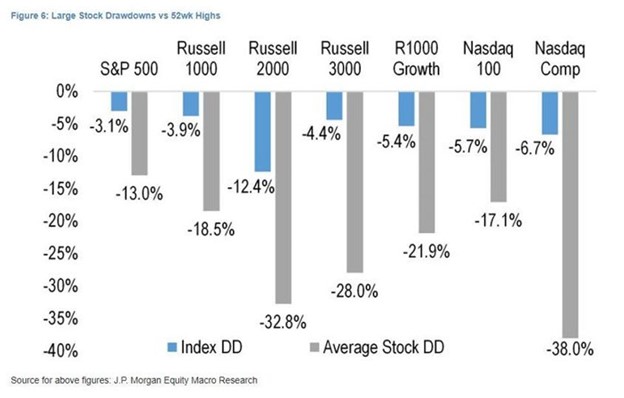
In the image above, you can see both the index drawdown (blue) and the average stock drawdown (grey) from their respective 52-week highs.
Across all of the indexes shown, the average stock is dramatically underperforming the index itself.
The disparity for the Nasdaq Composite Index is even more severe…
Even though the index had a maximum drawdown of -6.7%, the average stock drawdown was -38%.
What This Means for 2022
What this shows is that the major indexes are not a good representation of how most stocks are actually performing.
This doesn’t mean that you need to put all of your money into the mega-cap tech sector to find outperformance.
Far from it…
Instead, look for pockets of strength outside of the overcrowded tech space.
For example, I think real estate investment trusts (REITs) are likely to continue doing well into 2022.
Not only do they benefit from inflation, but rental rates will increase along with interest rates.
And don’t forget… the Fed has said they will raise rates several times next year.
The metaverse theme is also likely to be hot into 2022.
This is something I’ve talked a bit about recently, but I think this space could present some of the best trading opportunities in the coming year.
Stay tuned, as I’ll continue to update you each and every trading day on what I see coming.
Embrace the surge,
Ross Givens
Editor, Stock Surge Daily


