
As traders, we spend a lot of time looking for the perfect place to buy a stock.
At least I do.
I’ve written about how to buy a stock that’s in a strong uptrend…
I’ve talked about how to buy stocks following large share purchases from company insiders…
And I’ve told you how to buy stocks that the institutions are buying in bulk…
But what about when it’s time to sell?
How do you know when the move is likely over?
How do you know when it’s time to head for the exit?
Well, just like buying, it all has to do with supply and demand.
When a stock gets extended, demand starts to dry up, and that’s when prices start to plunge.
We’re going to talk about all that and more in today’s update, so please read on…
Top Five Signs of an Exhausted Stock
Here are the top five signs of exhaustion I look for that could mean it is time to sell…
1. Price is Greater than 100% above the 200-day Simple Moving Average
If you’re new to Stock Surge Daily, let’s quickly define what a simple moving average (SMA) is…
An SMA is a stock indicator that is available on almost every charting platform.
It is a dynamic line that plots the average price of a security over a given time period.
Traders typically use 50-day and 200-day SMAs, but they can be set to pretty much any length of time.
So, to see when a stock is extended, first plot a 200-day SMA on a daily stock chart.
Again, you can do this on any basic charting platform.
Then, note the value. If the stock price is double the value of the 200-day SMA, it could be extended.
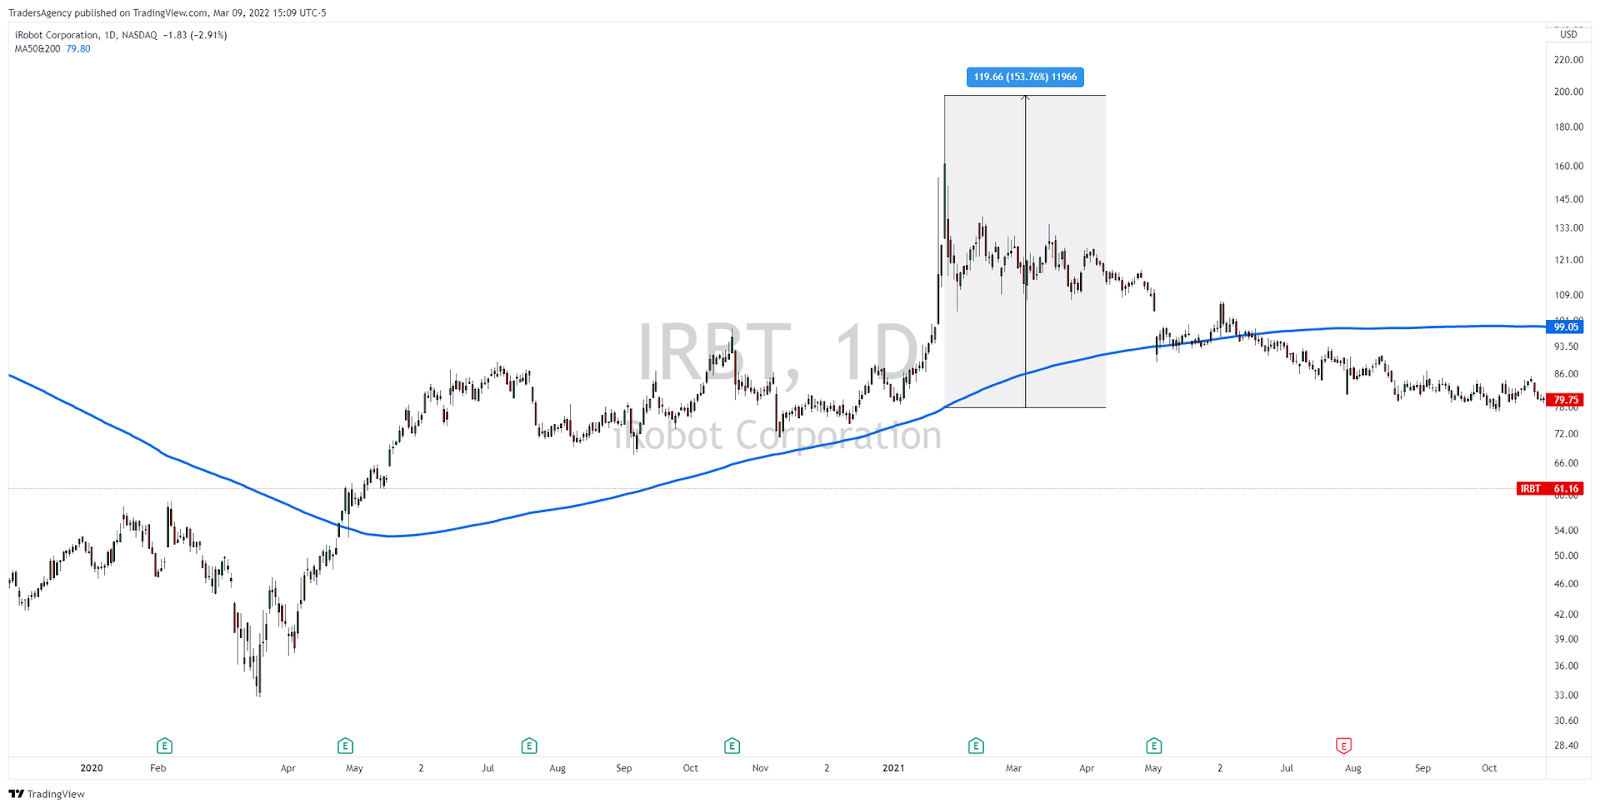
For a good example, check out shares of iRobot (IRBT) last year.
The stock had a great breakout after consolidating for a while, but then a strong earnings report sent the stock up over 150% above its 200-day SMA.
The shares are still down around 70% from those highs.
2. Volume is Greater than It Has Been Since Start of the Trend
Stocks will often make what is known as a “blow off top” at the end of a big move higher.
This is the result of buyers, driven by the fear of missing out (FOMO), piling in at the very last minute.
If the daily or weekly volume is the highest it has been since the uptrend began, proceed with caution!
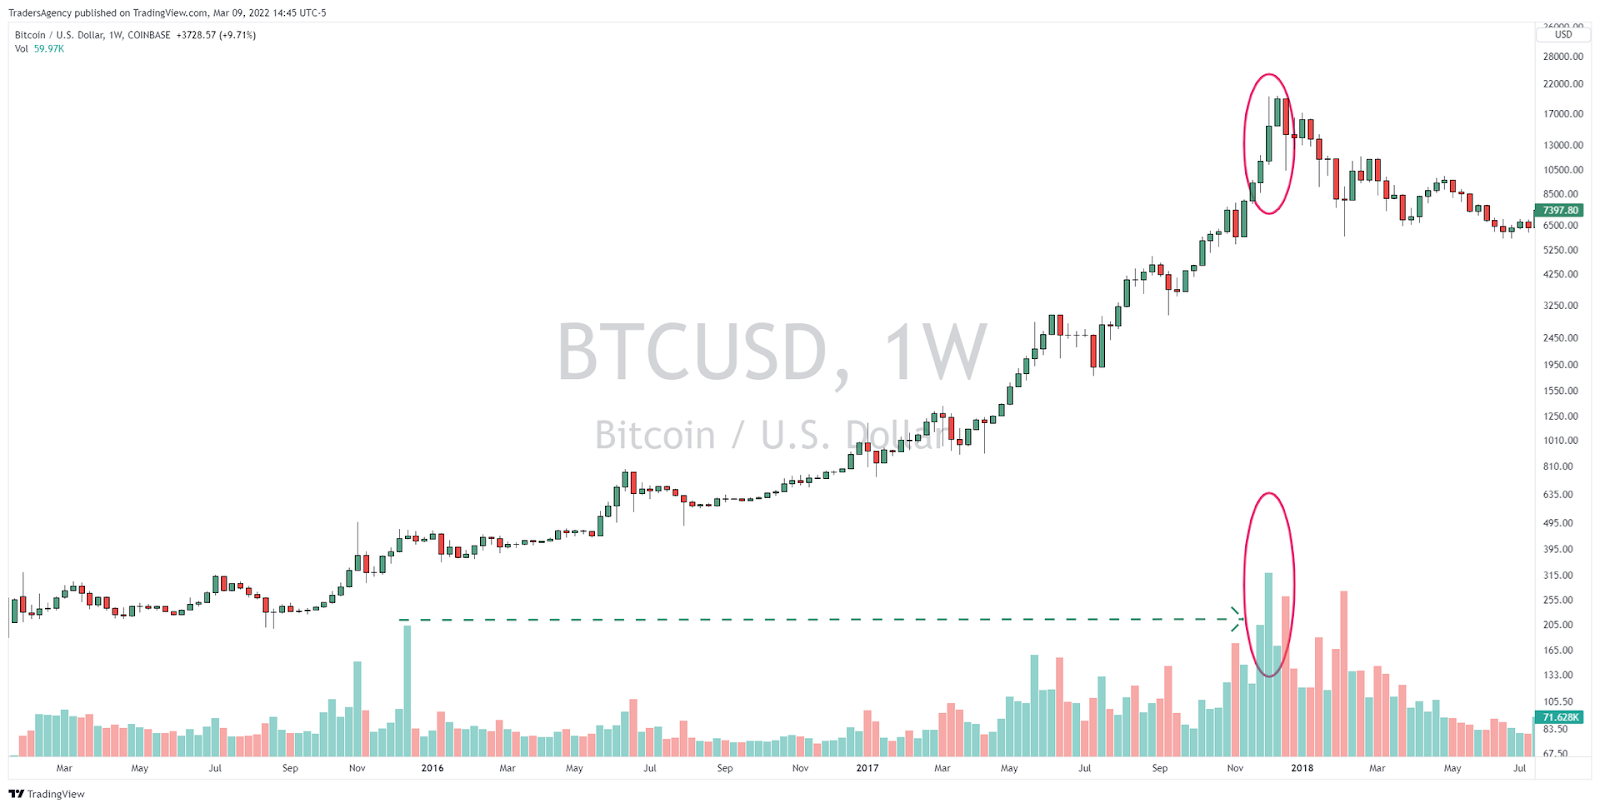
Take a look at the chart above for a perfect example…
Back in late 2017, BTC experienced a blow-off top on a weekly chart with exceptionally high volume.
The volume bar at the peak was greater than it was at any point during the two-year uptrend.
And the price proceeded to fall over 80% over the following year.
3. There’s a Big Gap Higher at the End of the Rally
I don’t know why, but you will often see the stock gap higher at the open (sometimes two to three days in a row) right at the end of a multi-month rally.

Tesla (TSLA) is a great example of this, as you can see in the daily chart above.
The stock saw several gap-ups in a row toward the end of each major rally.
This was an indication that FOMO had taken over and the last of the buyers were jumping on the bandwagon.
4. You See a Reversal Bar on the Weekly Chart
When trying to catch a big move, I like to step back to a weekly chart in order to keep things in perspective.
If you get a big down week on high volume, that is likely institutions beginning to sell.
You should do the same.
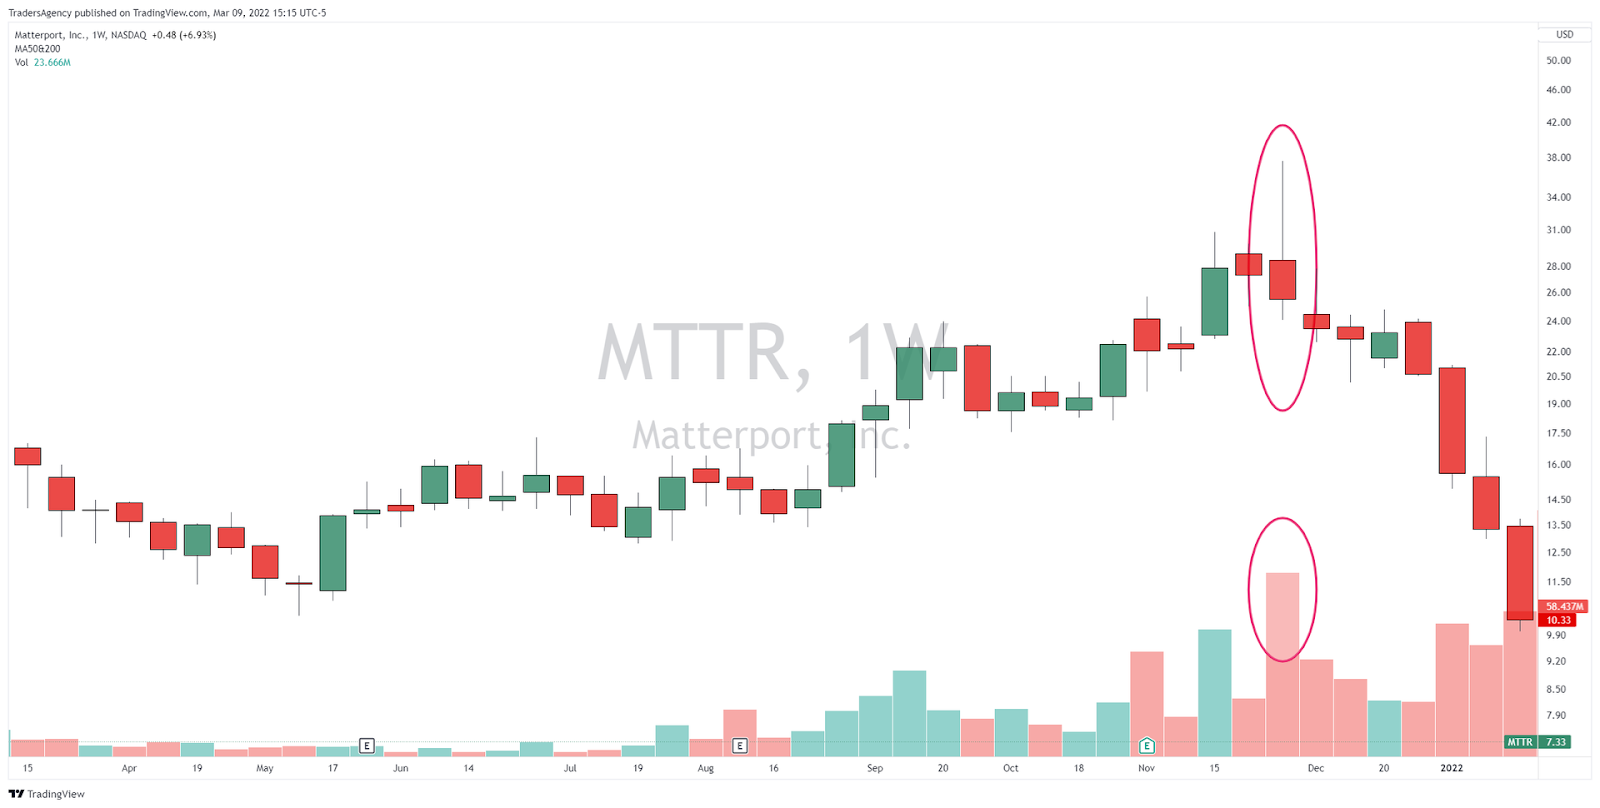
A good example of this sell signal is Matterport (MTTR).
On the weekly chart above, you can see that MTTR set an intra-week all-time high but then ended the week with a red candle on high volume, indicating that sellers were taking profits.
The stock proceeded to drop over 80% from that peak.
5. The Stock Makes a 50% Gain in Three Weeks
When a stock goes up too much too fast, investors usually take profits.
I do the same thing.
This selling causes price to pull back.
If a stock advances 50% in three weeks or less, expect a decent-sized pullback.
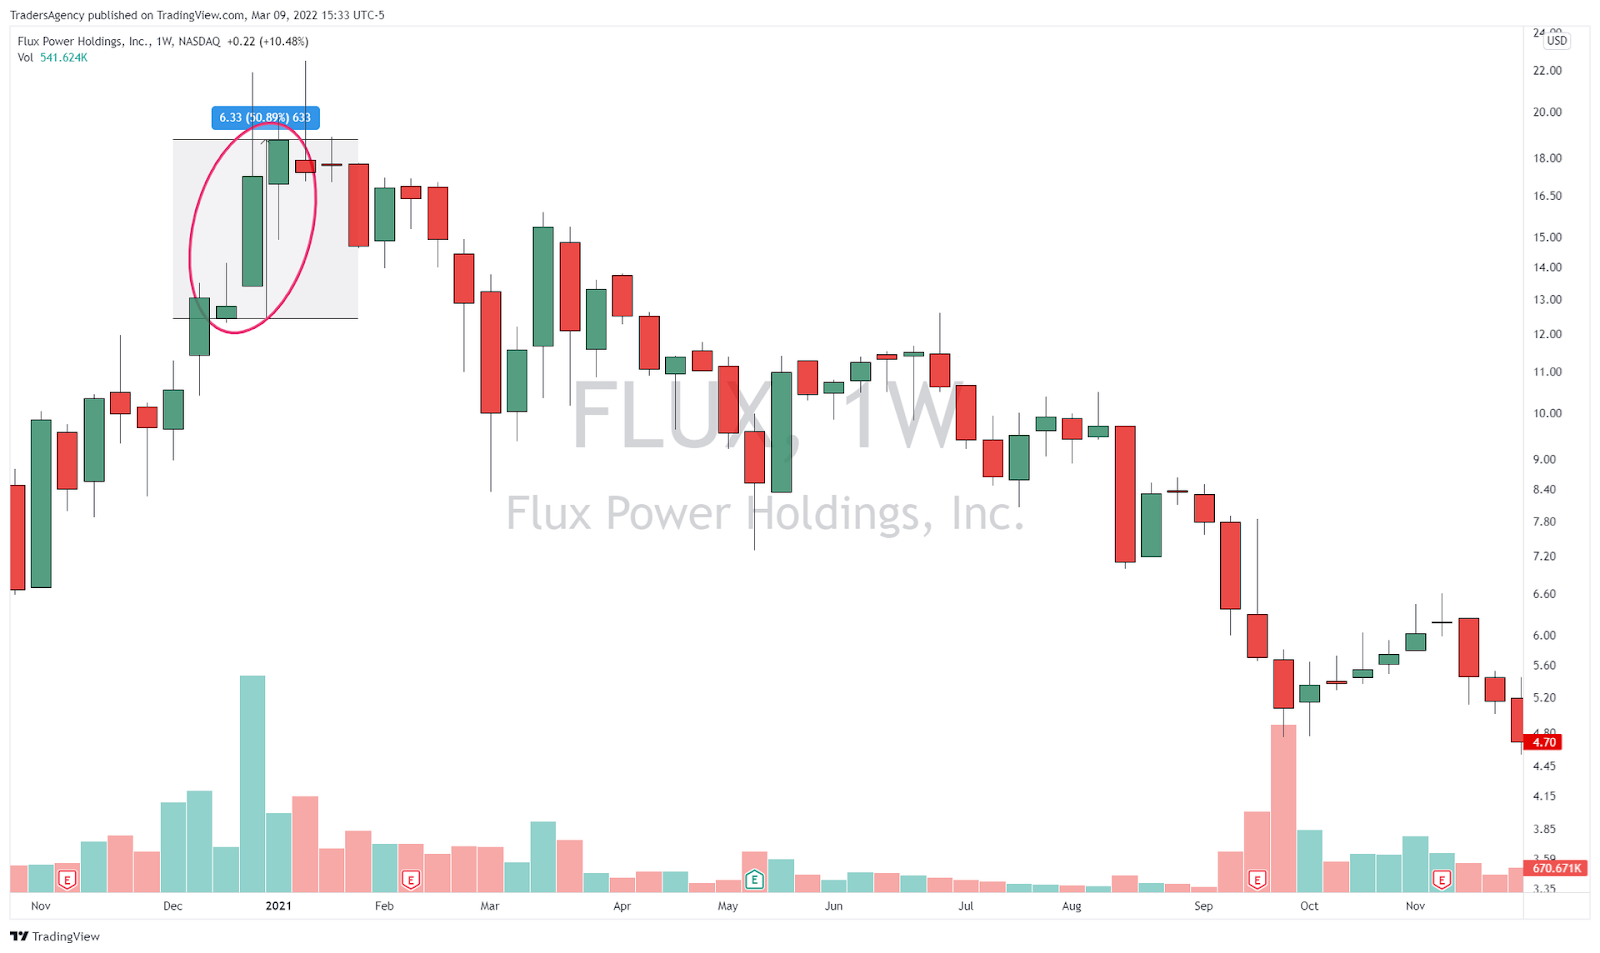
A good example of this rule can be seen in the weekly chart of Flux Power Holdings (FLUX) above.
The stock jumped over 50% during the final three weeks of its uptrend.
Since then, however, shares fell nearly 90% and wiped out a massive amount of value.
Now, I hope these examples have been helpful and that you keep them in mind…
The next time you find yourself in a strong stock making a fast move to the upside, think about these five telltale warning signs.
If you see your stock doing any of these things, it may be time to start considering a move to the exits before everyone else gets the same idea.
Embrace the surge,

Ross Givens
Editor, Stock Surge Daily
The post Five Reasons to Sell a Rising Stock appeared first on Stock Surge Daily.


