Is the small cap stock index in the Russell 2000 Index (RTY) setting up for selling or buying?
There are signs setting up on both sides…
And they could lead to either bullish or bearish trade opportunities.
So, let’s look at the RTY today and see whether the sellers or buyers are taking control of the market…
The Russell 2000 (RTY) Market Review
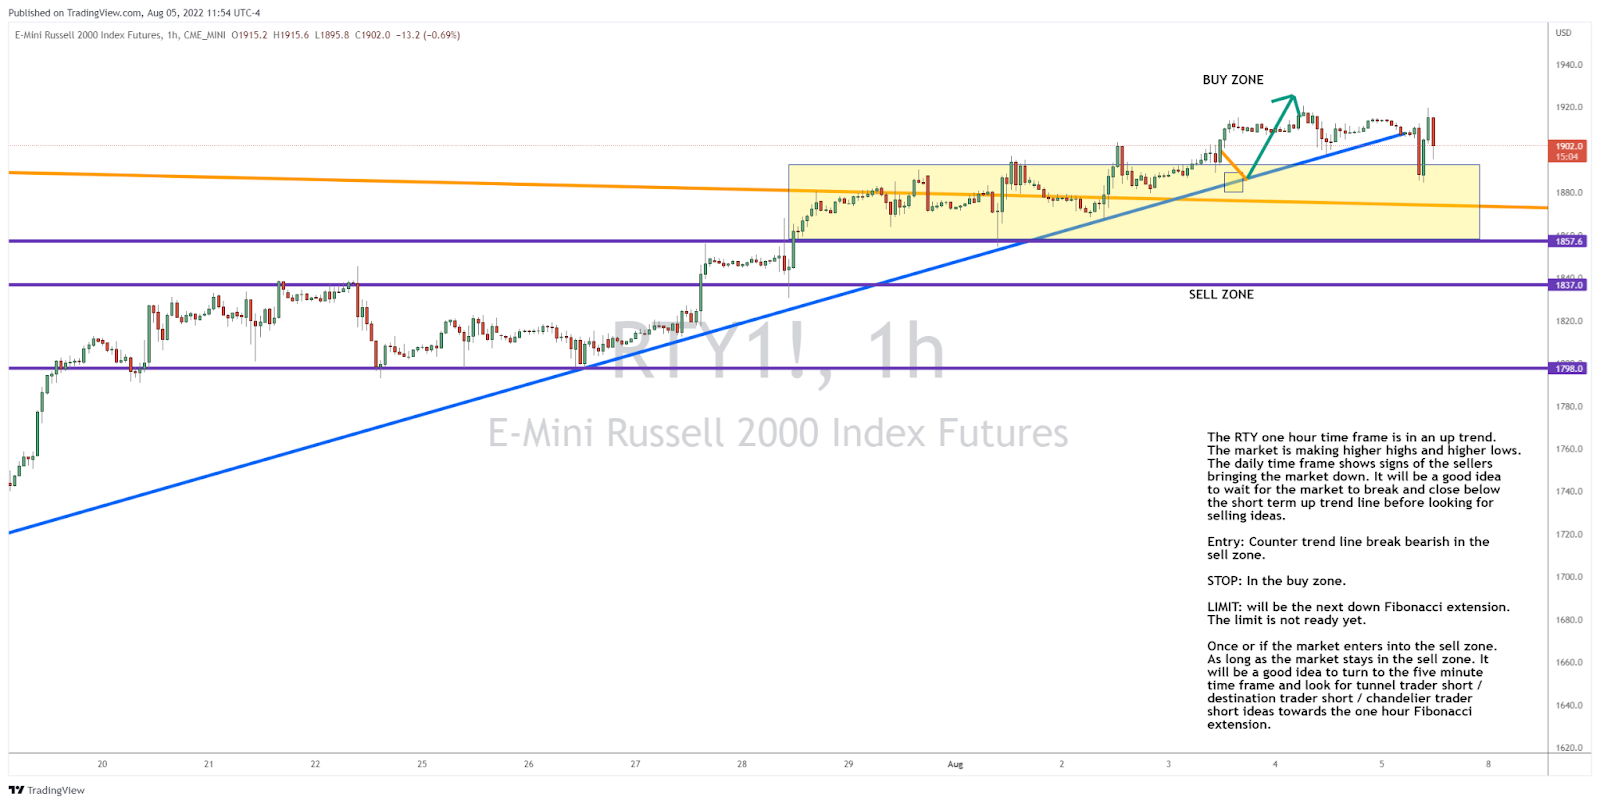
Here’s how the chart is setting up for the Russell 2000 (RTY) futures contract market…

The RTY one hour time frame is in an up trend, with the market making higher highs and higher lows.
However, the daily time frame shows signs of the sellers bringing the market down.
It will be a good idea to wait for the market to break and close below the short term up trend line before looking for selling ideas.
Entry: Counter trend line break bearish in the sell zone.
Stop: In the buy zone.
Limit: The limit is not ready yet. It will be the next down Fibonacci extension.
Once or if the market enters into the sell zone, and as long as it stays in the sell zone, it will be a good idea to turn to the five minute time frame and look for short Tunnel Trader / Destination Trader / Chandelier Trader ideas towards the one hour Fibonacci extension.
The Bottom Line
For more on the markets as well as trading education and trading ideas like this one, look for the next edition of Josh’s Daily Direction in your email inbox each and every trading day.
I’ll be bringing you more of my stock and futures contract trading tutorials as well as some additional trading ideas.
And if you know someone who’d love to make this a part of their daily trading routine, send them over to joshsdailydirection.com to get signed up!
Keep on trading,

P.S. Beyond the energy markets, I am finding great potential trades from my top stocks that I present on an ongoing basis in my premium trading service, Josh’s Top 5.
The post Buyers or Sellers Taking Control of the Russell 2000? appeared first on Josh Daily Direction.


