The Nasdaq 100 Index (NQ) is the leading index for bigger tech stocks that we follow very closely.
And this week, we are studying the index to try to find the next direction for the market.
With NQ at the top of its down channel, it could break into the buy zone and continue further upwards…
Or it could break its counter trend line bearish and take another pause.
So, let’s look at the technicals for NQ and see how it’s shaping up…
Analyzing the Nasdaq 100 (NQ)
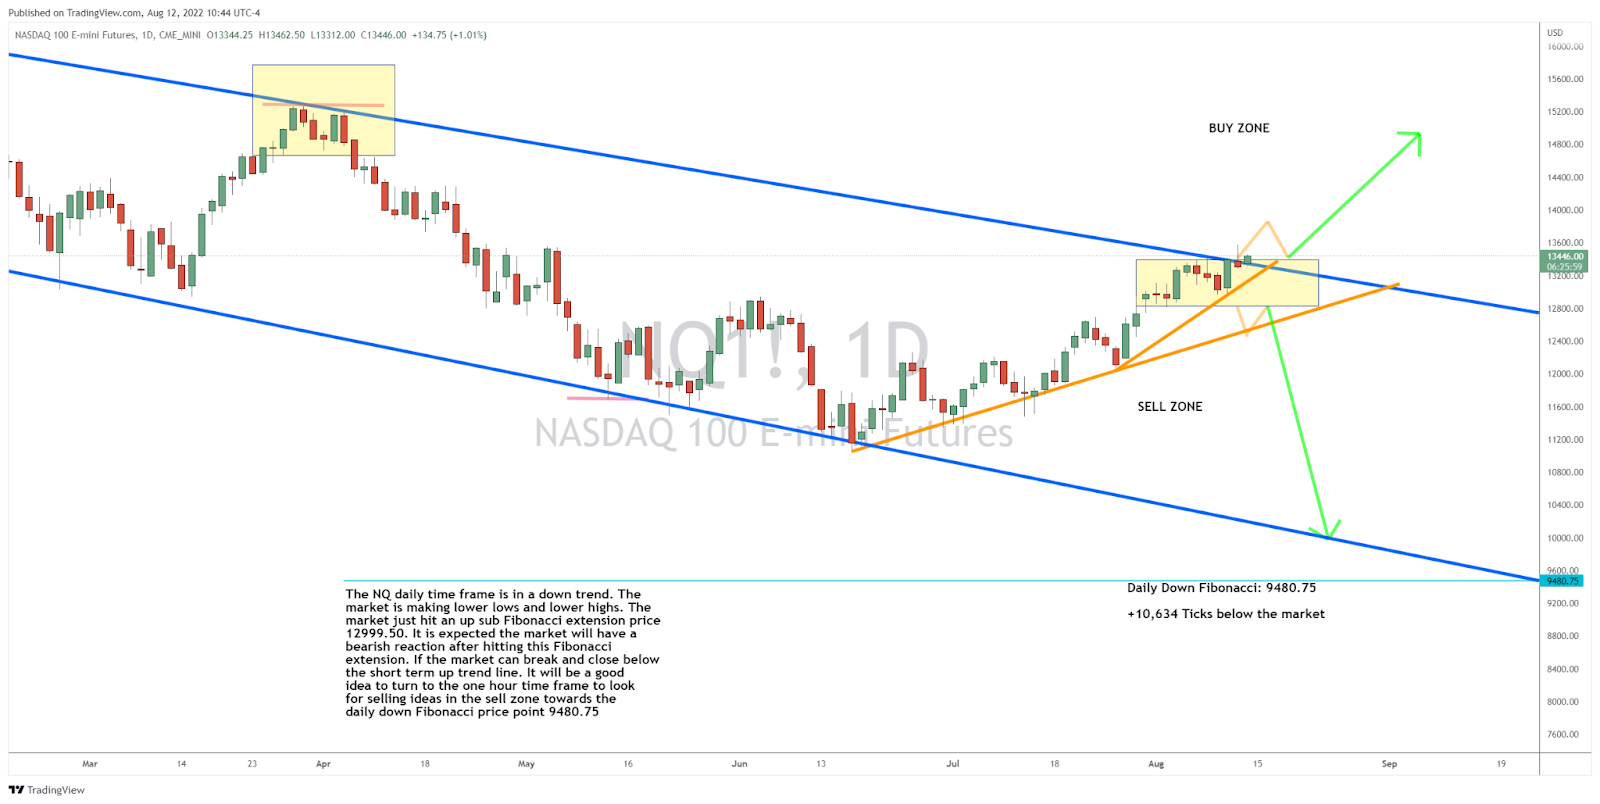
Here’s how the Nasdaq 100 Index futures contract (NQ) chart is showing the potential path as it sets up the next potential leg of a rally or a drop back down…

Nasdaq 100 Index Futures Contract (NQ) Price and Technical Analysis – Source: TradingView
The Nasdaq 100 Index futures contract (NQ) is in a downtrend, with the market making lower lows and lower highs.
The market just hit an upper sub Fibonacci extension price 12,999.50. It is expected that the market will have a bearish reaction after hitting this Fibonacci extension.
If the market can break and close below the short term up trend line, it would be a good idea to turn to the one hour time frame to look for selling ideas in the sell zone towards the daily down Fibonacci price point of 9,480.75.
The Bottom Line
For more on the markets as well as trading education and trading ideas like this one, look for the next edition of Josh’s Daily Direction in your email inbox each and every trading day.
I’ll be bringing you more of my stock and futures contract trading tutorials as well as some additional trading ideas.
And if you know someone who’d love to make this a part of their daily trading routine, send them over to joshsdailydirection.com to get signed up!
Keep on trading,

P.S. While the futures markets may provide some big gains ahead, my colleague and expert trader Ross Givens has been working on a different market…
The post Why We’re Watching the NQ for the Next New Trade Idea appeared first on Josh Daily Direction.


